## Heatmap and Scatter Plot Analysis: Rich vs. Lazy Regimes
### Overview
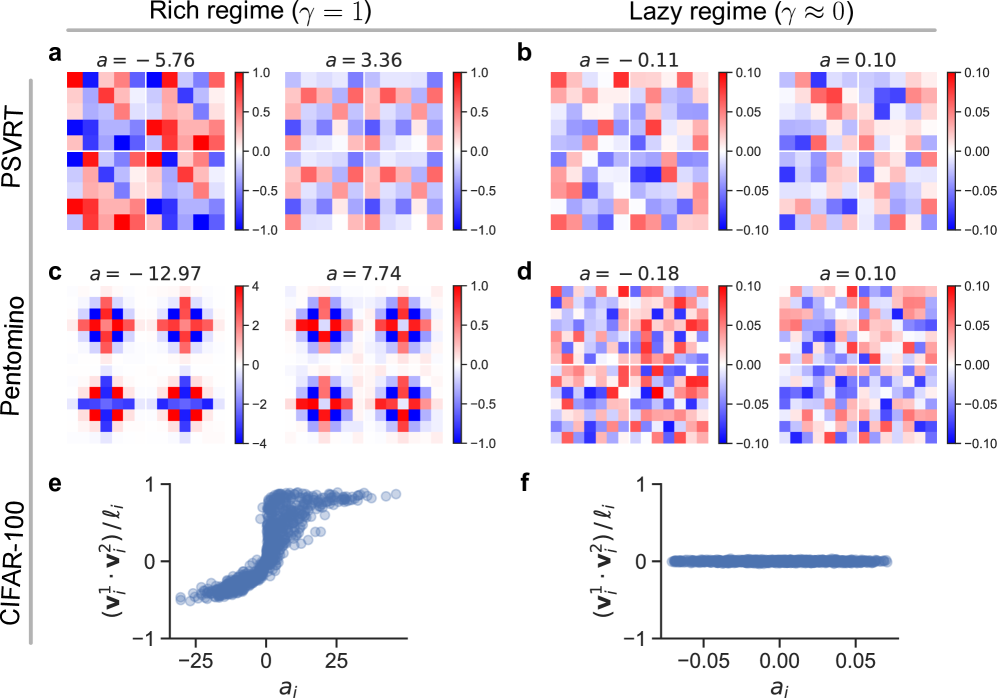
The image presents a comparative analysis of two regimes (Rich: γ = 1; Lazy: γ ≈ 0) using heatmaps and scatter plots. Key elements include parameter values (a), correlation matrices, and normalized vector products. Data is organized into six subsections (a-f), with spatial grounding in quadrants.
---
### Components/Axes
#### Heatmaps (a-d)
- **X/Y Axes**: Unlabeled categorical indices (likely feature pairs).
- **Color Scales**:
- **PSVRT (a, b)**: -1.0 to 1.0 (blue = negative, red = positive).
- **Pentomino (c, d)**: -4.0 to 4.0 (blue = negative, red = positive).
- **Parameters (a)**:
- **Rich Regime**: a = -5.76, 3.36, -12.97, 7.74.
- **Lazy Regime**: a = -0.11, 0.10, -0.18, 0.10.
#### Scatter Plots (e, f)
- **X-Axis**: Parameter `a_i` (ranging from -25 to 25 for e; -0.05 to 0.05 for f).
- **Y-Axis**: Normalized vector product `(v_i^1 · v_i^2)/ℓ_i` (unitless).
- **Data Points**:
- **e (Rich Regime)**: Blue dots show a nonlinear trend (negative → positive).
- **f (Lazy Regime)**: Blue dots form a flat line near 0.
---
### Detailed Analysis
#### Heatmaps
- **Rich Regime (a, c)**:
- **a = -5.76**: Strong negative/positive correlations (red/blue blocks).
- **a = 3.36**: Moderate alternating patterns.
- **a = -12.97**: High-magnitude correlations (peaks at ±4.0).
- **a = 7.74**: Symmetric checkerboard-like patterns.
- **Lazy Regime (b, d)**:
- **a = -0.11/0.10/-0.18**: Minimal variation (values clustered near 0).
- **Color Scale**: Tight range (-0.10 to 0.10), indicating weak correlations.
#### Scatter Plots
- **e (Rich Regime)**:
- **Trend**: Nonlinear increase from ~-1 to ~1 as `a_i` rises from -25 to 25.
- **Outlier**: Sharp rise near `a_i = 0`.
- **f (Lazy Regime)**:
- **Trend**: Flat line at ~0, indicating no correlation.
---
### Key Observations
1. **Regime-Specific Patterns**:
- Rich regime heatmaps (a, c) exhibit structured, high-magnitude correlations.
- Lazy regime heatmaps (b, d) show near-zero correlations.
2. **Scatter Plot Divergence**:
- Rich regime (e) demonstrates measurable trends; Lazy regime (f) does not.
3. **Parameter Sensitivity**:
- Large `a` values (e.g., ±12.97) amplify correlation magnitudes in heatmaps.
---
### Interpretation
The data suggests that the parameter γ (Rich vs. Lazy regime) critically influences system behavior:
- **Rich Regime (γ = 1)**: High variability and structured correlations dominate, with parameter `a` modulating correlation strength and pattern symmetry.
- **Lazy Regime (γ ≈ 0)**: Correlations are negligible, and trends vanish, implying γ suppresses dynamic interactions.
- **Scatter Plot Insight**: The normalized vector product `(v_i^1 · v_i^2)/ℓ_i` acts as a sensitivity metric, revealing regime-dependent dependencies on `a_i`.
Uncertainties include the exact mapping of categorical indices in heatmaps and the functional form of the nonlinear trend in plot e. Further analysis could clarify the role of `ℓ_i` in normalizing vector products.