## Bar Chart: F1-Score Comparison Across Caching Strategies
### Overview
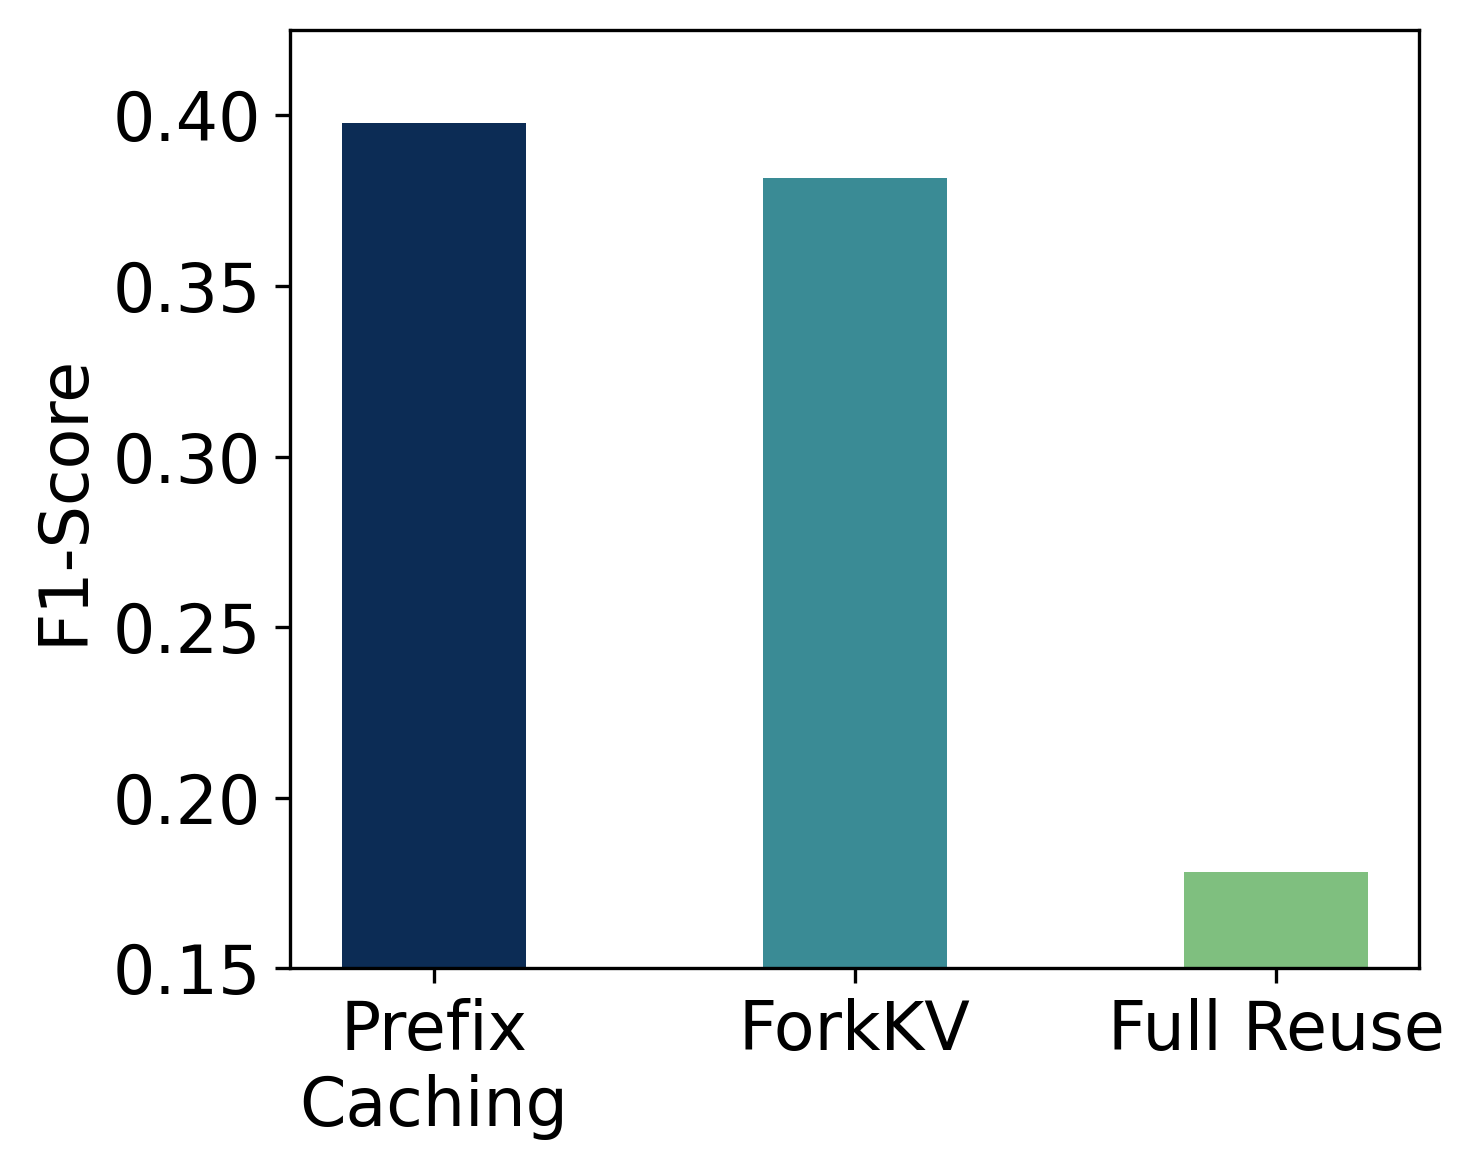
The chart compares the F1-Score performance of three caching strategies: Prefix Caching, ForkKV, and Full Reuse. The y-axis represents F1-Score values ranging from 0.15 to 0.40, while the x-axis categorizes the strategies. Three distinct bars are present, with varying heights and colors.
### Components/Axes
- **X-Axis (Categories)**:
- Prefix Caching (dark blue bar)
- ForkKV (teal bar)
- Full Reuse (light green bar)
- **Y-Axis (F1-Score)**:
- Scale: 0.15 to 0.40 in increments of 0.05
- Label: "F1-Score"
- **Legend**:
- Positioned on the right side of the chart
- Colors:
- Dark blue = Prefix Caching
- Teal = ForkKV
- Light green = Full Reuse
### Detailed Analysis
1. **Prefix Caching**:
- Bar height: ~0.39–0.40 (dark blue)
- Position: Leftmost bar, tallest among the three
2. **ForkKV**:
- Bar height: ~0.37–0.38 (teal)
- Position: Middle bar, slightly shorter than Prefix Caching
3. **Full Reuse**:
- Bar height: ~0.17 (light green)
- Position: Rightmost bar, significantly shorter than the other two
### Key Observations
- The F1-Score for Prefix Caching and ForkKV are nearly identical, both exceeding 0.35.
- Full Reuse has the lowest F1-Score, approximately 0.17, which is ~50% lower than the other two strategies.
- The y-axis starts at 0.15, emphasizing the disparity in Full Reuse's performance.
### Interpretation
The data suggests that Prefix Caching and ForkKV are similarly effective, with high F1-Scores indicating balanced precision and recall. Full Reuse, however, performs poorly, potentially due to inefficiencies in data retrieval or higher error rates. The stark contrast between Full Reuse and the other two strategies highlights its inferiority in this context. The chart uses distinct colors to differentiate strategies, ensuring clarity in comparison. The absence of error bars or confidence intervals limits the ability to assess statistical significance, but the visual disparity is clear.