\n
## Heatmaps: Layer Activation Distribution by Category
### Overview
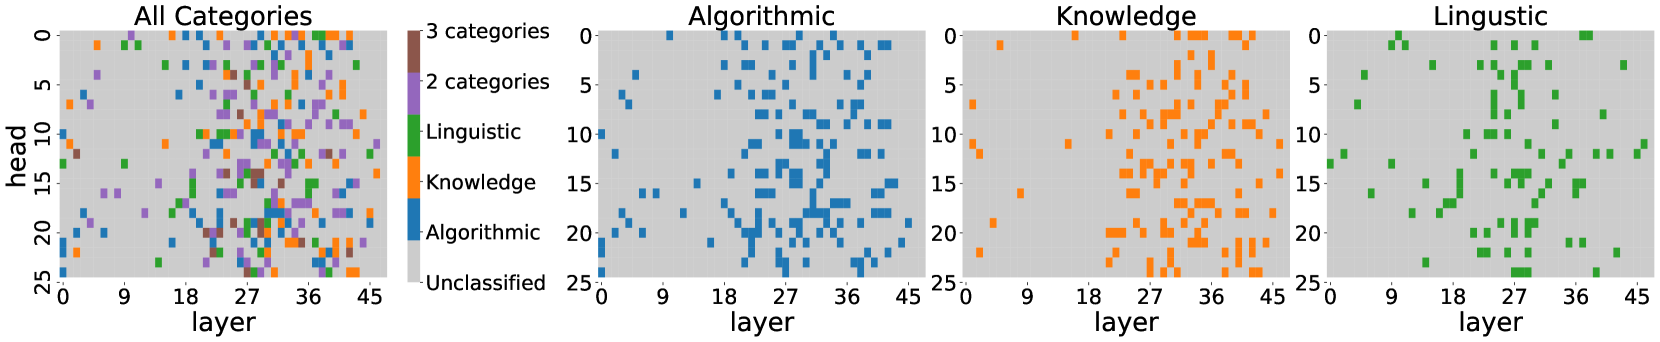
The image presents four heatmaps visualizing the distribution of activations across layers and heads for different categories. The heatmaps show the relationship between 'layer' (x-axis) and 'head' (y-axis), with color intensity representing the activation level for a specific category. The first heatmap shows all categories combined, while the subsequent three focus on 'Algorithmic', 'Knowledge', and 'Linguistic' categories respectively.
### Components/Axes
* **X-axis (all heatmaps):** 'layer', ranging from approximately 0 to 45, with markers at 0, 9, 18, 27, 36, and 45.
* **Y-axis (all heatmaps):** 'head', ranging from approximately 0 to 25, with markers at 0, 5, 10, 15, 20, and 25.
* **Color (all heatmaps):** Represents activation level.
* **Legend (first heatmap):**
* '3 categories' - Pink
* '2 categories' - Purple
* 'Linguistic' - Green
* 'Knowledge' - Orange
* 'Algorithmic' - Blue
* 'Unclassified' - Grey
* **Titles:** Each heatmap is labeled with the category it represents (e.g., "All Categories", "Algorithmic").
### Detailed Analysis or Content Details
**1. All Categories Heatmap:**
* The heatmap displays a complex pattern of activations across layers and heads.
* There is a high density of activations in the lower-left corner (low layer, low head).
* The pink ('3 categories') and purple ('2 categories') activations are concentrated in the rightmost layers (around 45).
* Green ('Linguistic') activations are scattered throughout, with some concentration in the middle layers (around 18-27).
* Orange ('Knowledge') activations are also scattered, with a slight concentration in the middle layers.
* Blue ('Algorithmic') activations are more prominent in the lower layers (0-18).
* Grey ('Unclassified') activations are sparse, mostly in the lower layers.
**2. Algorithmic Heatmap:**
* The 'Algorithmic' heatmap shows a strong concentration of blue activations in the lower layers (0-18).
* The density of activations decreases as the layer number increases.
* There is a relatively uniform distribution of activations across heads.
**3. Knowledge Heatmap:**
* The 'Knowledge' heatmap displays a concentration of orange activations in the middle layers (approximately 18-36).
* Activations are more sparse in the lower and higher layers.
* There is a noticeable cluster of activations around layer 27.
**4. Linguistic Heatmap:**
* The 'Linguistic' heatmap shows a concentration of green activations in the middle to higher layers (approximately 9-45).
* Activations are relatively evenly distributed across heads.
* There is a noticeable concentration of activations around layer 18.
### Key Observations
* 'Algorithmic' activations are primarily located in the earlier layers, suggesting that algorithmic processing occurs first.
* 'Knowledge' activations are concentrated in the middle layers, indicating that knowledge representation builds upon initial processing.
* 'Linguistic' activations are more prominent in the later layers, suggesting that linguistic analysis happens after initial processing and knowledge representation.
* The 'All Categories' heatmap shows a mix of activations, reflecting the combined activity of all categories.
* The 'Unclassified' category has minimal activation, indicating that most inputs are classified into one of the other categories.
### Interpretation
The heatmaps demonstrate how different categories of information are processed across the layers of a neural network. The spatial distribution of activations suggests a hierarchical processing structure, where 'Algorithmic' features are extracted first, followed by 'Knowledge' representation, and finally 'Linguistic' analysis. The concentration of activations in specific layers for each category indicates that different layers are specialized for processing different types of information. The 'Unclassified' category's low activation suggests the model is effective at categorizing the input data. The patterns observed could be used to understand the internal workings of the model and identify potential areas for improvement. The visualization provides insight into the model's feature extraction and representation learning process.