## Area Chart: Compute vs. Multiplicative Contribution
### Overview
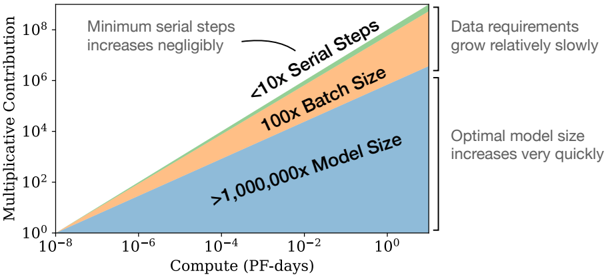
The image is an area chart that illustrates the relationship between compute (measured in PF-days) and multiplicative contribution, highlighting the impact of serial steps, batch size, and model size. The chart uses a log-log scale for both axes. The areas are colored to represent different factors influencing the multiplicative contribution.
### Components/Axes
* **X-axis:** Compute (PF-days), logarithmic scale from 10<sup>-8</sup> to 10<sup>0</sup>. Axis markers are present at 10<sup>-8</sup>, 10<sup>-6</sup>, 10<sup>-4</sup>, 10<sup>-2</sup>, and 10<sup>0</sup>.
* **Y-axis:** Multiplicative Contribution, logarithmic scale from 10<sup>0</sup> to 10<sup>8</sup>. Axis markers are present at 10<sup>0</sup>, 10<sup>2</sup>, 10<sup>4</sup>, 10<sup>6</sup>, and 10<sup>8</sup>.
* **Areas:**
* **Green:** Represents "<10x Serial Steps". The upper bound of this area is labeled "Minimum serial steps increases negligibly".
* **Orange:** Represents "100x Batch Size".
* **Blue:** Represents ">1,000,000x Model Size". The lower bound of this area starts at the x and y axis origin.
* **Annotations:**
* "Data requirements grow relatively slowly" is positioned to the right of the orange area.
* "Optimal model size increases very quickly" is positioned below the previous annotation, to the right of the blue area.
### Detailed Analysis
* **Green Area (<10x Serial Steps):**
* The green area starts at approximately (10<sup>-8</sup>, 10<sup>0</sup>) and increases linearly on the log-log scale.
* At a compute of 10<sup>0</sup> PF-days, the multiplicative contribution is approximately 10<sup>5</sup>.
* The trend is upward, indicating that as compute increases, the multiplicative contribution due to serial steps also increases, but negligibly.
* **Orange Area (100x Batch Size):**
* The orange area starts where the green area ends and increases linearly on the log-log scale.
* At a compute of 10<sup>0</sup> PF-days, the multiplicative contribution is approximately 10<sup>7</sup>.
* The trend is upward, indicating that as compute increases, the multiplicative contribution due to batch size also increases.
* **Blue Area (>1,000,000x Model Size):**
* The blue area starts at approximately (10<sup>-8</sup>, 10<sup>0</sup>) and increases linearly on the log-log scale.
* At a compute of 10<sup>0</sup> PF-days, the multiplicative contribution is approximately 10<sup>8</sup>.
* The trend is upward, indicating that as compute increases, the multiplicative contribution due to model size increases very quickly.
### Key Observations
* The chart uses a log-log scale, which compresses the data and allows for the visualization of exponential relationships.
* The model size has the most significant impact on multiplicative contribution, as indicated by the largest area.
* Serial steps have the least impact on multiplicative contribution, as indicated by the smallest area.
* The annotations highlight that data requirements grow relatively slowly, while optimal model size increases very quickly.
### Interpretation
The chart illustrates the trade-offs between different factors influencing the multiplicative contribution in a computational model. It suggests that increasing model size has the most significant impact on performance, but also implies that this comes with a cost of rapidly increasing data requirements. Serial steps have a relatively minor impact. The chart emphasizes the importance of optimizing model size for performance, but also highlights the need to manage data requirements effectively. The logarithmic scales suggest exponential relationships between compute and multiplicative contribution for each factor.