## Log-Log Chart: Scaling Contributions to Model Performance
### Overview
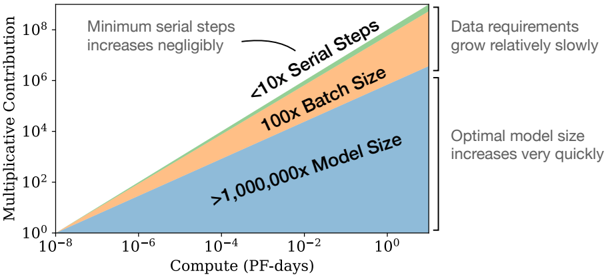
This image is a log-log plot illustrating the scaling relationships between computational resources (measured in PetaFLOP-days) and the multiplicative contribution of three key factors to a machine learning model's performance. The chart uses stacked, colored areas to show how the relative importance of Model Size, Batch Size, and Serial Steps changes as available compute increases by eight orders of magnitude.
### Components/Axes
* **X-Axis:** Labeled **"Compute (PF-days)"**. It is a logarithmic scale ranging from **10⁻⁸** to **10⁰** (0.00000001 to 1) PetaFLOP-days.
* **Y-Axis:** Labeled **"Multiplicative Contribution"**. It is a logarithmic scale ranging from **10⁰** to **10⁸** (1 to 100,000,000).
* **Data Series (Stacked Areas from bottom to top):**
1. **Blue Area:** Labeled **">1,000,000x Model Size"**. This is the largest and steepest area.
2. **Orange Area:** Labeled **"100x Batch Size"**. This is the middle area with a moderate slope.
3. **Green Area:** Labeled **"<10x Serial Steps"**. This is the top, thinnest area with a nearly flat slope.
* **Annotations:**
* **Top-Left:** Text states **"Minimum serial steps increases negligibly"** with an arrow pointing to the green "Serial Steps" area.
* **Right Side (Top):** Text states **"Data requirements grow relatively slowly"**.
* **Right Side (Bottom):** Text states **"Optimal model size increases very quickly"**.
### Detailed Analysis
The chart depicts power-law relationships, evident as straight lines on the log-log plot.
* **Trend Verification & Data Points:**
* **Model Size (Blue):** The line slopes upward very steeply. At the lowest compute (10⁻⁸ PF-days), its contribution is near 10⁰. At the highest compute (10⁰ PF-days), its contribution exceeds 10⁶. The label indicates its contribution scales by a factor greater than **1,000,000x** across the plotted range.
* **Batch Size (Orange):** The line slopes upward moderately. Its contribution starts near 10⁰ at low compute and reaches approximately 10⁴ at high compute. The label indicates a scaling factor of **100x**.
* **Serial Steps (Green):** The line is nearly horizontal, showing minimal increase. Its contribution remains close to 10⁰ (between 1 and 10) across the entire compute range. The label confirms a scaling factor of **<10x**.
* **Spatial Grounding:** The legend is embedded directly within the chart as text labels placed on their corresponding colored areas. The "Serial Steps" label is in the top-left quadrant, the "Batch Size" label is in the center, and the "Model Size" label spans the lower-right quadrant. The explanatory annotations are positioned in the top-left and right margins.
### Key Observations
1. **Dominant Scaling Factor:** Model Size is overwhelmingly the largest contributor to performance gains as compute increases, with its multiplicative contribution growing over six orders of magnitude.
2. **Negligible Scaling Factor:** The number of Serial Steps (likely referring to sequential computation depth or time steps) contributes almost nothing to scaling performance; its requirement is essentially constant.
3. **Moderate Scaling Factor:** Batch Size shows a meaningful but secondary scaling effect, growing by two orders of magnitude.
4. **Divergent Growth Rates:** The three factors scale at dramatically different rates, visualized by the diverging slopes of the stacked areas. The gap between the contribution of Model Size and the others widens exponentially with compute.
### Interpretation
This chart visually encapsulates a core principle of modern scaling laws in machine learning: **performance gains from increased compute are primarily achieved by scaling up model parameters (size), not by significantly increasing training data batch sizes or the depth of sequential computation.**
The data suggests that for efficient scaling:
* **Investment Priority:** Engineering effort and resources should focus on building larger models and the infrastructure to train them, as this yields the highest return on compute investment.
* **Architectural Implication:** The near-flat "Serial Steps" line implies that model architectures do not need to become significantly deeper or more sequential to benefit from more compute. Parallelism (which relates to batch size) is more important than sequential depth.
* **Practical Constraint:** The annotation "Data requirements grow relatively slowly" indicates that while more data is needed for larger models, the data scaling requirement is less aggressive than the model size scaling requirement. This is a crucial insight for resource planning in AI research and development.
In essence, the chart argues that the path to more powerful AI, given more compute, is primarily through **wider and larger models**, not through fundamentally more complex sequential algorithms or massively larger training batches.