## Line Chart: Multiplicative Contribution vs Compute (PF-days)
### Overview
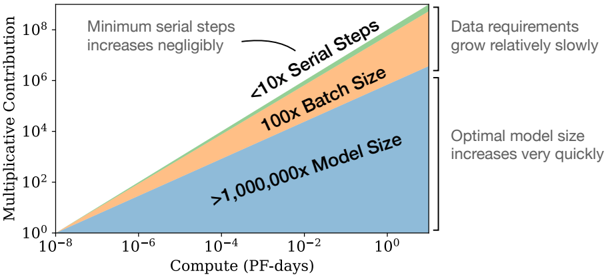
The chart illustrates the relationship between computational resources (PF-days) and multiplicative contributions across three scenarios: negligible serial steps, batch size scaling, and model size scaling. It uses logarithmic scales for both axes to emphasize exponential trends.
### Components/Axes
- **X-axis (Compute)**: Logarithmic scale from 10⁻⁸ to 10⁰ PF-days.
- **Y-axis (Multiplicative Contribution)**: Logarithmic scale from 10⁰ to 10⁸.
- **Legend**:
- Green: "Minimum serial steps increases negligibly"
- Orange: "<10x Serial Steps" and "100x Batch Size"
- Blue: ">1,000,000x Model Size"
- **Annotations**:
- "Data requirements grow relatively slowly" (right side)
- "Optimal model size increases very quickly" (right side)
- "Minimum serial steps increases negligibly" (top-left)
### Detailed Analysis
1. **Lines and Trends**:
- **Green Line**: Nearly flat, indicating minimal change in multiplicative contribution as compute increases. Peaks at ~10⁸ near 10⁰ PF-days.
- **Orange Line**: Moderate upward slope, representing contributions from "<10x Serial Steps" and "100x Batch Size." Ranges from ~10² to ~10⁶.
- **Blue Line**: Steep upward slope, showing exponential growth for ">1,000,000x Model Size." Dominates at higher compute levels (~10⁸ at 10⁰ PF-days).
2. **Shaded Areas**:
- Orange-shaded region under the orange line highlights contributions from batch size scaling.
- Blue-shaded region under the blue line emphasizes model size scaling dominance.
3. **Axis Markers**:
- X-axis: 10⁻⁸, 10⁻⁶, 10⁻⁴, 10⁻², 10⁰.
- Y-axis: 10⁰, 10², 10⁴, 10⁶, 10⁸.
### Key Observations
- **Dominance of Model Size**: The blue line's steep slope suggests that increasing model size (>1Mx) drives multiplicative contributions far more than batch size or serial steps.
- **Negligible Serial Steps**: The green line's flatness implies serial steps have minimal impact across compute scales.
- **Data vs. Compute**: Annotations confirm data requirements grow slowly, while optimal model size scales rapidly with compute.
### Interpretation
The chart demonstrates that computational efficiency is primarily driven by model scale rather than batch size or serial step optimizations. As compute resources grow, larger models (>1Mx) become exponentially more impactful, while smaller-scale optimizations (e.g., batch size) contribute less. This aligns with trends in AI/ML where model parallelism and scale often outweigh incremental hardware improvements. The logarithmic axes underscore the exponential nature of these relationships, suggesting diminishing returns for compute investments below 10⁻² PF-days.