## Line Chart: Solve Rate vs. Number of Hints Required to Deduce Secret Code
### Overview
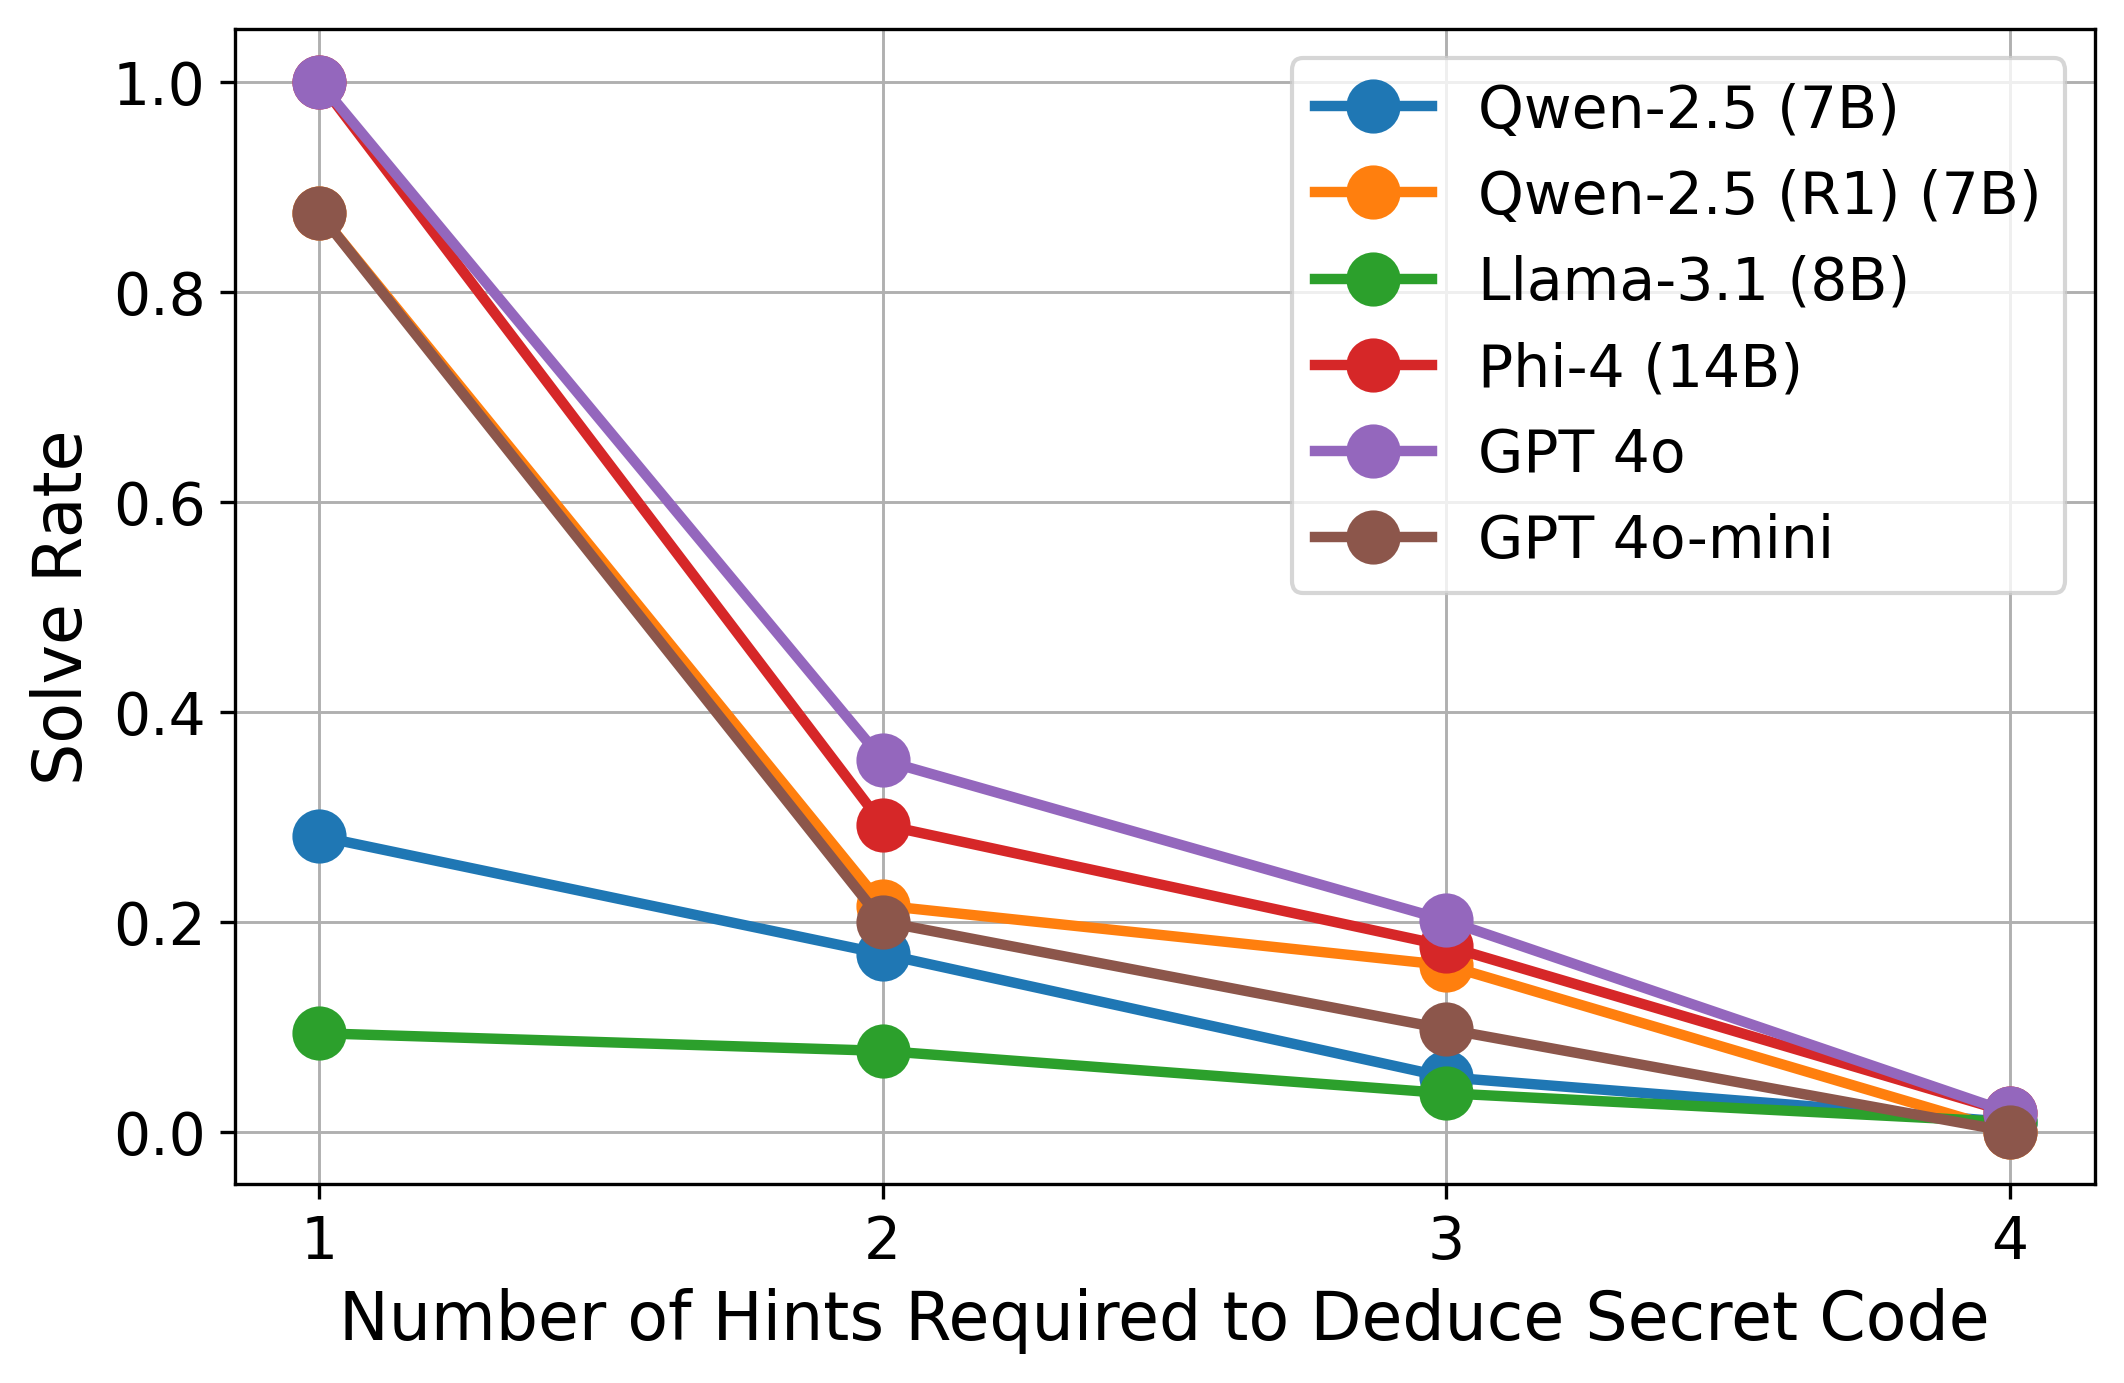
This is a line chart comparing the performance of six different large language models (LLMs) on a task requiring the deduction of a secret code. The chart plots the "Solve Rate" (y-axis) against the "Number of Hints Required to Deduce Secret Code" (x-axis). The data shows a clear inverse relationship: as the number of required hints increases, the solve rate for all models decreases significantly.
### Components/Axes
* **Chart Type:** Line chart with markers.
* **X-Axis:**
* **Title:** "Number of Hints Required to Deduce Secret Code"
* **Scale:** Discrete integer values: 1, 2, 3, 4.
* **Y-Axis:**
* **Title:** "Solve Rate"
* **Scale:** Linear scale from 0.0 to 1.0, with major gridlines at intervals of 0.2.
* **Legend:** Located in the top-right quadrant of the chart area. It contains six entries, each with a colored line and circular marker:
1. **Blue:** Qwen-2.5 (7B)
2. **Orange:** Qwen-2.5 (R1) (7B)
3. **Green:** Llama-3.1 (8B)
4. **Red:** Phi-4 (14B)
5. **Purple:** GPT 4o
6. **Brown:** GPT 4o-mini
### Detailed Analysis
The following data points are approximate values derived from visual inspection of the chart.
**Trend Verification:** All six data series exhibit a consistent downward slope from left to right, indicating that solve rates decline as the task complexity (number of hints required) increases.
**Data Series Breakdown (from highest to lowest initial solve rate at 1 hint):**
1. **GPT 4o (Purple Line):**
* **Trend:** Steep decline from the highest starting point.
* **Data Points:**
* 1 Hint: Solve Rate ≈ 1.0
* 2 Hints: Solve Rate ≈ 0.35
* 3 Hints: Solve Rate ≈ 0.20
* 4 Hints: Solve Rate ≈ 0.02
2. **GPT 4o-mini (Brown Line):**
* **Trend:** Very steep decline, closely mirroring GPT 4o but starting slightly lower.
* **Data Points:**
* 1 Hint: Solve Rate ≈ 0.88
* 2 Hints: Solve Rate ≈ 0.20
* 3 Hints: Solve Rate ≈ 0.10
* 4 Hints: Solve Rate ≈ 0.00
3. **Phi-4 (14B) (Red Line):**
* **Trend:** Steep decline, starting from a high point.
* **Data Points:**
* 1 Hint: Solve Rate ≈ 1.0 (appears to overlap with GPT 4o)
* 2 Hints: Solve Rate ≈ 0.30
* 3 Hints: Solve Rate ≈ 0.18
* 4 Hints: Solve Rate ≈ 0.01
4. **Qwen-2.5 (R1) (7B) (Orange Line):**
* **Trend:** Moderate decline.
* **Data Points:**
* 1 Hint: Solve Rate ≈ 0.88 (appears to overlap with GPT 4o-mini)
* 2 Hints: Solve Rate ≈ 0.22
* 3 Hints: Solve Rate ≈ 0.15
* 4 Hints: Solve Rate ≈ 0.01
5. **Qwen-2.5 (7B) (Blue Line):**
* **Trend:** Moderate, steady decline from a much lower starting point.
* **Data Points:**
* 1 Hint: Solve Rate ≈ 0.28
* 2 Hints: Solve Rate ≈ 0.17
* 3 Hints: Solve Rate ≈ 0.05
* 4 Hints: Solve Rate ≈ 0.01
6. **Llama-3.1 (8B) (Green Line):**
* **Trend:** Very shallow, almost flat decline from the lowest starting point.
* **Data Points:**
* 1 Hint: Solve Rate ≈ 0.09
* 2 Hints: Solve Rate ≈ 0.08
* 3 Hints: Solve Rate ≈ 0.04
* 4 Hints: Solve Rate ≈ 0.01
### Key Observations
1. **Universal Performance Drop:** Every model's performance degrades as the number of hints increases from 1 to 4. The drop is most precipitous between 1 and 2 hints for the top-performing models.
2. **Performance Stratification at 1 Hint:** There is a massive performance gap at the simplest task (1 hint). GPT 4o, Phi-4, GPT 4o-mini, and Qwen-2.5 (R1) all start with solve rates near or at 1.0 or 0.88. In contrast, Qwen-2.5 (7B) starts at ~0.28, and Llama-3.1 (8B) starts at ~0.09.
3. **Convergence at High Complexity:** By the time 4 hints are required, the solve rates for all models converge to near zero (≤ 0.02), indicating the task becomes extremely difficult for all tested models.
4. **Model Grouping:** The models naturally cluster into three performance tiers based on the chart:
* **Top Tier (High Initial Performance):** GPT 4o, Phi-4, GPT 4o-mini, Qwen-2.5 (R1).
* **Middle Tier:** Qwen-2.5 (7B).
* **Bottom Tier:** Llama-3.1 (8B).
### Interpretation
The data suggests a strong inverse correlation between task complexity (operationalized as the number of hints needed for deduction) and model success rate. This is an expected result, confirming that multi-step reasoning or information integration becomes exponentially harder for current LLMs as the required steps increase.
The chart reveals significant disparities in the models' baseline reasoning or code-breaking abilities. The top-tier models (GPT 4o, Phi-4) demonstrate near-perfect performance on the simplest version of the task, suggesting robust capabilities for single-step deduction. However, their sharp decline indicates these capabilities do not scale linearly with added complexity.
The stark difference between Qwen-2.5 (7B) and its "R1" variant (Qwen-2.5 (R1) (7B)) is notable. The "R1" version performs on par with the top-tier models, while the base 7B model performs much worse. This implies that the "R1" modification (potentially a reinforcement learning or reasoning-focused fine-tune) dramatically improves performance on this specific type of logical deduction task.
Llama-3.1 (8B)'s consistently low performance across all hint levels suggests it may lack the specific reasoning priors or pattern recognition skills required for this code-deduction task, even at its simplest form.
In summary, the chart is a clear visualization of the "complexity cliff" in LLM reasoning tasks. It highlights that while some models excel at simple puzzles, their advantage diminishes rapidly as puzzles require integrating more pieces of information, and it underscores the potential of targeted model tuning (as seen with Qwen-2.5 (R1)) to significantly boost performance in specific cognitive domains.