# Technical Document Extraction: Line Graph Analysis
## Header
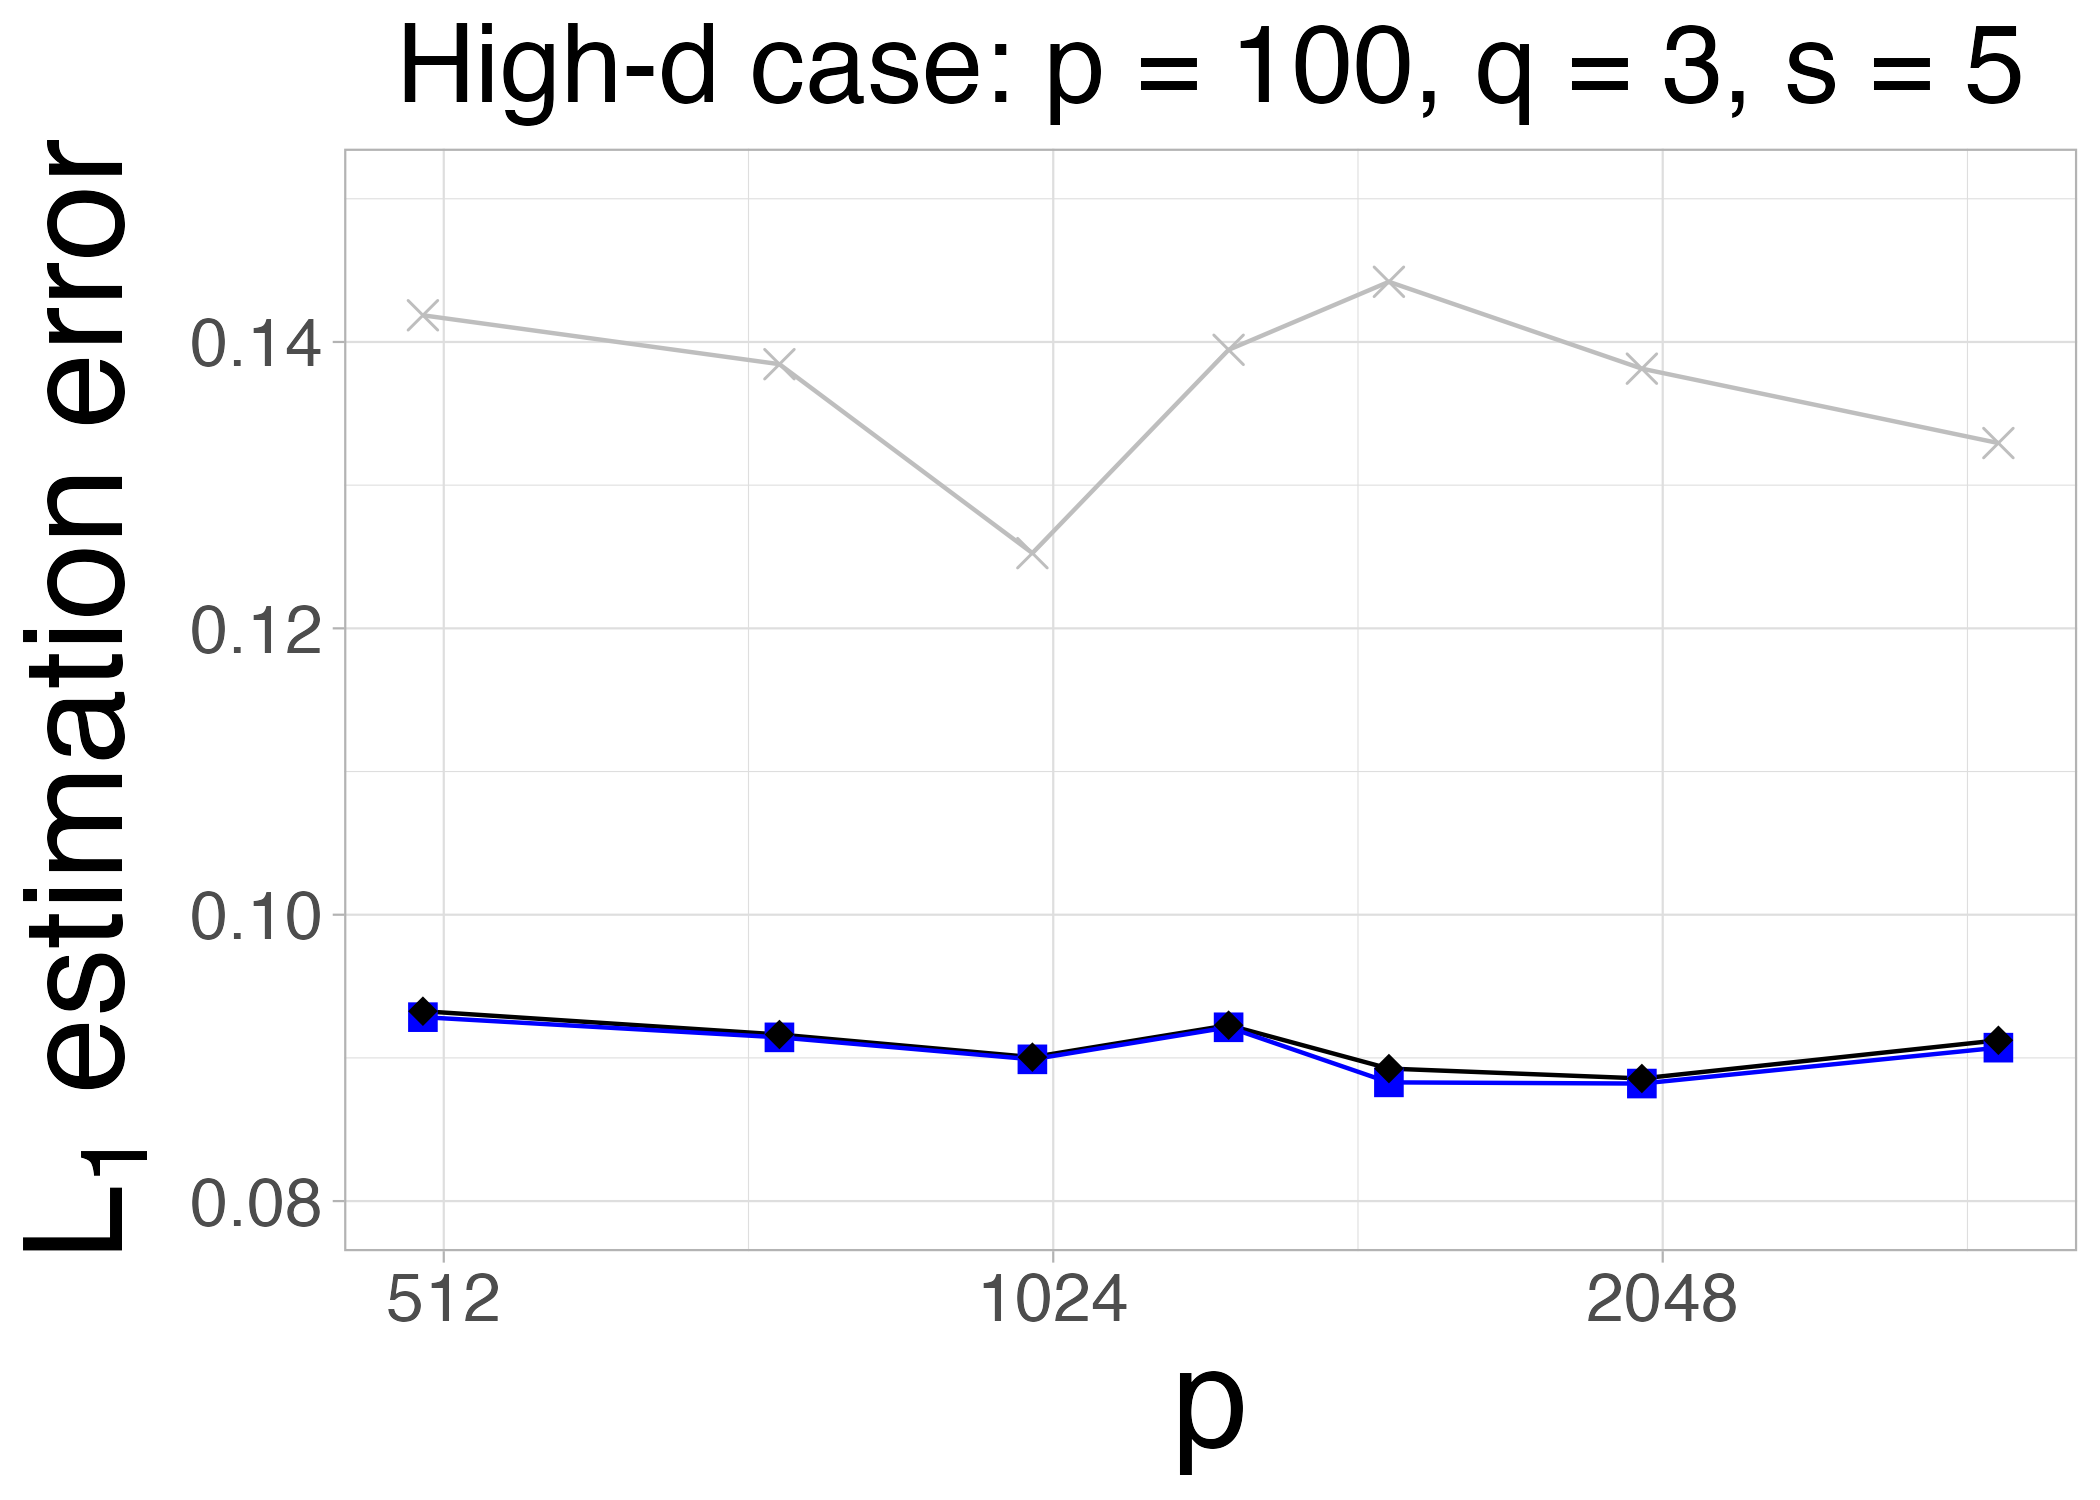
**Title**: High-d case: p = 100, q = 3, s = 5
## Main Chart
### Axes
- **X-axis**:
- Label: `p`
- Markers: `512`, `1024`, `2048`
- **Y-axis**:
- Label: `L₁ estimation error`
- Range: `0.08` to `0.14`
### Data Series
1. **Gray Line with 'x' Markers** (Legend: "High-d case"):
- **Trend**:
- Decreases from `p=512` (0.14) to `p=1024` (0.125)
- Increases to `p=2048` (0.14)
- Slight decrease to `p=4096` (0.135)
- **Key Points**:
- `p=512`: 0.14
- `p=1024`: 0.125
- `p=2048`: 0.14
- `p=4096`: 0.135
2. **Blue Line with 'Diamond' Markers** (Legend: "Low-d case"):
- **Trend**:
- Relatively flat with minor fluctuations
- Slight dip at `p=2048` (0.09)
- Slight rise at `p=4096` (0.09)
- **Key Points**:
- `p=512`: 0.09
- `p=1024`: 0.09
- `p=2048`: 0.09
- `p=4096`: 0.09
### Legend
- **Position**: Top-right corner
- **Labels**:
- Gray: "High-d case"
- Blue: "Low-d case"
## Footer
**Note**: No additional textual information present.
## Spatial Grounding & Validation
- **Legend Colors**:
- Gray matches "High-d case" line markers (`x`)
- Blue matches "Low-d case" line markers (`diamond`)
- **Trend Verification**:
- Gray line shows non-linear behavior (downward then upward trend)
- Blue line remains stable with minimal variation
## Component Isolation
1. **Header**: Title and parameters (`p=100`, `q=3`, `s=5`)
2. **Main Chart**: Dual-line graph with labeled axes and legend
3. **Footer**: No content
## Data Table Reconstruction
| p | High-d case (Gray) | Low-d case (Blue) |
|-------|--------------------|-------------------|
| 512 | 0.14 | 0.09 |
| 1024 | 0.125 | 0.09 |
| 2048 | 0.14 | 0.09 |
| 4096 | 0.135 | 0.09 |
## Language Declaration
- **Primary Language**: English
- **Translated Text**: None required (no non-English content detected)