## Diagram: Symbolic vs. Embedding Model Approaches
### Overview
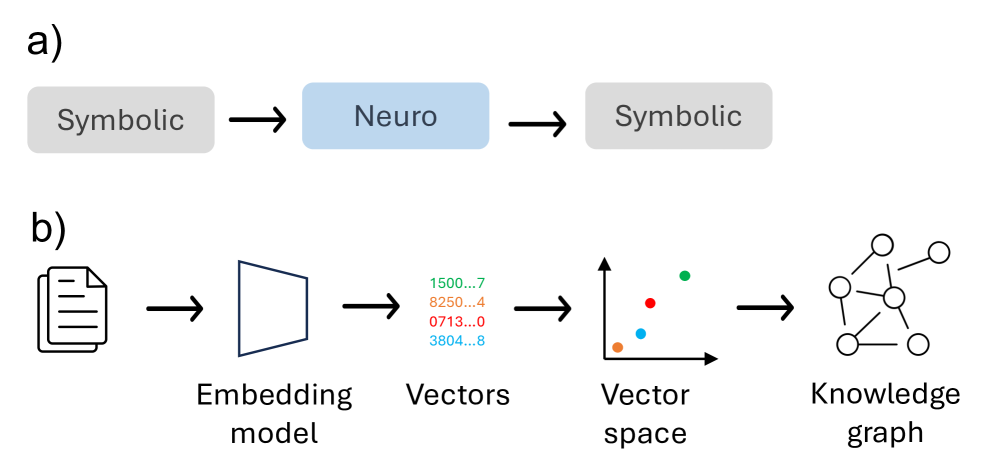
The image presents two diagrams, labeled 'a)' and 'b)', illustrating different approaches to knowledge representation and processing. Diagram 'a)' depicts a symbolic approach, transitioning from symbolic representation to a neural network ('Neuro') and back to symbolic representation. Diagram 'b)' illustrates an embedding model approach, starting from a document, converting it into vectors via an embedding model, mapping these vectors into a vector space, and finally representing the knowledge as a graph.
### Components/Axes
**Diagram a):**
* **Labels:** "Symbolic", "Neuro"
* **Flow:** Left to right, indicated by arrows.
**Diagram b):**
* **Labels:** "Embedding model", "Vectors", "Vector space", "Knowledge graph"
* **Vectors:** List of numbers: "1500...7", "8250...4", "0713...0", "3804...8"
* **Vector Space:** A 2D plot with no explicit axes labels, containing four data points: green (top-right), red (top-middle), orange (bottom-left), and blue (bottom-middle).
* **Flow:** Left to right, indicated by arrows.
### Detailed Analysis
**Diagram a):**
* The diagram shows a flow from "Symbolic" to "Neuro" to "Symbolic". The "Symbolic" blocks are gray, while the "Neuro" block is light blue.
**Diagram b):**
* The diagram starts with an icon representing a document, which flows into an "Embedding model".
* The output of the "Embedding model" is represented as "Vectors", with example numerical values listed.
* These vectors are then mapped into a "Vector space", represented by a 2D plot.
* The vector space contains four data points:
* A green data point in the top-right quadrant.
* A red data point in the top-middle quadrant.
* An orange data point in the bottom-left quadrant.
* A blue data point in the bottom-middle quadrant.
* Finally, the "Vector space" is transformed into a "Knowledge graph", represented by a network of interconnected nodes.
### Key Observations
* Diagram 'a)' represents a more traditional, rule-based approach, while diagram 'b)' represents a modern, data-driven approach using embeddings and neural networks.
* The "Vectors" in diagram 'b)' are represented by truncated numerical values, suggesting high-dimensional vectors.
* The "Vector space" provides a visual representation of the relationships between different data points based on their vector embeddings.
### Interpretation
The image contrasts two different paradigms for knowledge representation and processing. The first, 'a)', uses explicit symbolic representations and potentially rule-based systems, augmented by neural networks. The second, 'b)', leverages embedding models to transform data into vector representations, enabling the creation of knowledge graphs. The embedding model approach allows for capturing semantic relationships between data points in a continuous vector space, which can then be used to build more complex knowledge structures. The transition from vectors to a vector space and then to a knowledge graph highlights the process of transforming numerical representations into structured knowledge.