## Diagram: Symbolic-Neuro-Symbolic Transformation and Knowledge Graph Construction
### Overview
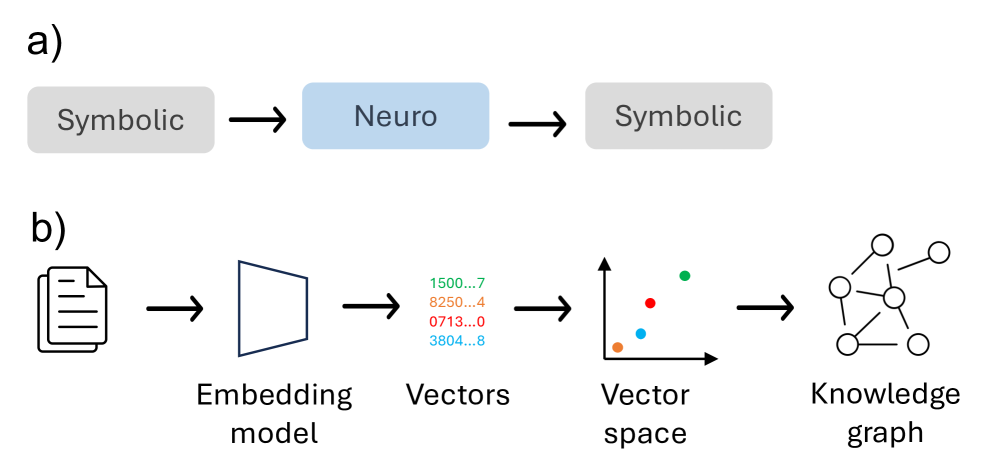
The image illustrates two interconnected processes:
1. **Symbolic-Neuro-Symbolic Transformation** (a): A bidirectional flow between symbolic representations and neural processing.
2. **Knowledge Graph Construction** (b): A pipeline from raw text to vector embeddings, vector space visualization, and finally a knowledge graph.
---
### Components/Axes
#### Part a) Symbolic-Neuro-Symbolic Flow
- **Components**:
- **Symbolic** (gray box, left): Represents rule-based or logical systems.
- **Neuro** (blue box, center): Denotes neural network processing.
- **Symbolic** (gray box, right): Output of neural processing converted back to symbolic form.
- **Flow Direction**: Left → Center → Right.
#### Part b) Knowledge Graph Pipeline
- **Components**:
1. **Embedding Model** (icon: document → hexagon): Converts text to numerical vectors.
2. **Vectors** (numerical values):
- `1500.7`, `8250.4`, `0713.0`, `3804.8` (color-coded: green, red, blue, orange).
3. **Vector Space** (2D plot):
- **Axes**: Labeled "Vector space" (x-axis and y-axis).
- **Data Points**:
- Green: `(1500.7, 8250.4)`
- Red: `(0713.0, 3804.8)`
- Blue: `(1500.7, 3804.8)`
- Orange: `(8250.4, 1500.7)`
4. **Knowledge Graph** (network of nodes): Represents semantic relationships.
---
### Detailed Analysis
#### Part a)
- The blue "Neuro" box is centrally positioned, emphasizing its role as the intermediary between symbolic systems.
- Arrows indicate a unidirectional flow from symbolic to neuro and back, suggesting iterative refinement.
#### Part b)
1. **Embedding Model**:
- Input: Document (text).
- Output: Vectors (numerical representations).
2. **Vector Space**:
- Points are plotted with coordinates derived from the vectors.
- Colors correspond to the legend:
- Green: `(1500.7, 8250.4)`
- Red: `(0713.0, 3804.8)`
- Blue: `(1500.7, 3804.8)`
- Orange: `(8250.4, 1500.7)`
- Spatial distribution suggests clustering or relationships between vectors.
3. **Knowledge Graph**:
- Nodes (circles) and edges (lines) represent conceptual relationships.
- No explicit labels on nodes, implying abstract or generic concepts.
---
### Key Observations
1. **Color Consistency**:
- Vector colors in the plot match the legend (green, red, blue, orange).
2. **Vector Magnitude**:
- Values like `8250.4` (highest) and `0713.0` (lowest) indicate varying feature importance.
3. **Knowledge Graph Structure**:
- Dense connections suggest complex interdependencies between concepts.
---
### Interpretation
1. **Symbolic-Neuro-Symbolic Loop**:
- Highlights the integration of neural learning with symbolic reasoning, enabling machines to learn from data while retaining interpretability.
2. **Vector Space Clustering**:
- Proximity of points (e.g., green and blue near `(1500.7, 3804.8)`) implies semantic similarity in the embedded text.
3. **Knowledge Graph Construction**:
- The pipeline demonstrates how raw text is transformed into a structured representation of knowledge, enabling tasks like question-answering or recommendation systems.
4. **Anomalies**:
- The red point `(0713.0, 3804.8)` is isolated from others, potentially indicating an outlier or unique concept.
This diagram underscores the synergy between neural and symbolic AI, bridging data-driven learning with structured knowledge representation.