## Line Chart: Accuracy vs. Time
### Overview
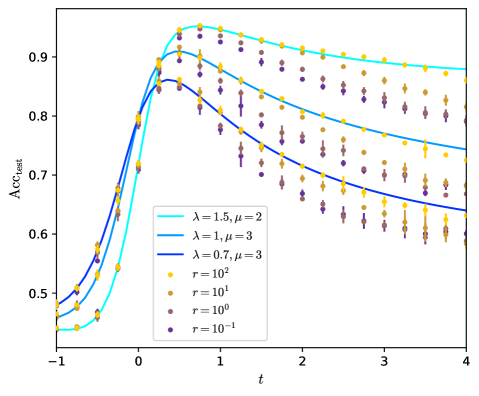
The image presents a line chart illustrating the relationship between accuracy (Acc<sub>test</sub>) and time (t) under varying parameters λ, μ, and r. The chart displays multiple lines, each representing a different combination of these parameters. Data points are scattered along each line, indicating individual measurements or observations.
### Components/Axes
* **X-axis:** Labeled as "t", ranging approximately from -1 to 4.
* **Y-axis:** Labeled as "Acc<sub>test</sub>", ranging approximately from 0.5 to 0.95.
* **Legend:** Located in the top-left corner, listing the following parameter combinations:
* λ = 1.5, μ = 2 (Light Blue)
* λ = 1, μ = 3 (Blue)
* λ = 0.7, μ = 3 (Dark Blue)
* r = 10<sup>2</sup> (Yellow)
* r = 10<sup>1</sup> (Orange)
* r = 10<sup>0</sup> (Brown/Reddish)
* r = 10<sup>-1</sup> (Purple)
### Detailed Analysis
The chart contains seven distinct lines, each representing a different set of parameters.
* **λ = 1.5, μ = 2 (Light Blue):** This line starts at approximately (-1, 0.52) and rises sharply, reaching a peak around (0.5, 0.93). It then plateaus, remaining relatively stable around 0.91-0.92 for t > 1.
* **λ = 1, μ = 3 (Blue):** This line begins at approximately (-1, 0.53) and increases rapidly, reaching a maximum around (0.7, 0.92). It then gradually declines, falling to approximately 0.82 at t = 2 and 0.74 at t = 4.
* **λ = 0.7, μ = 3 (Dark Blue):** Starting at approximately (-1, 0.53), this line exhibits a similar upward trend to the others, peaking around (0.6, 0.91). It then decreases more steeply than the previous line, reaching approximately 0.68 at t = 2 and 0.62 at t = 4.
* **r = 10<sup>2</sup> (Yellow):** This line starts at approximately (-1, 0.55) and rises to a peak around (0.5, 0.88). It then declines slowly, remaining around 0.78 at t = 2 and 0.72 at t = 4.
* **r = 10<sup>1</sup> (Orange):** Beginning at approximately (-1, 0.54), this line increases to a peak around (0.6, 0.86). It then decreases, reaching approximately 0.74 at t = 2 and 0.68 at t = 4.
* **r = 10<sup>0</sup> (Brown/Reddish):** Starting at approximately (-1, 0.52), this line rises to a peak around (0.7, 0.84). It then declines, reaching approximately 0.70 at t = 2 and 0.64 at t = 4.
* **r = 10<sup>-1</sup> (Purple):** This line starts at approximately (-1, 0.51) and rises to a peak around (0.6, 0.82). It then declines, reaching approximately 0.66 at t = 2 and 0.60 at t = 4.
### Key Observations
* All lines initially exhibit an increasing trend, indicating improving accuracy with increasing time.
* The lines corresponding to different values of λ and μ reach their peaks at different times, with higher λ values generally leading to earlier peaks.
* The lines corresponding to different values of r all decline after reaching their peaks, suggesting a diminishing return in accuracy as r increases.
* The lines with higher values of λ and μ generally maintain higher accuracy levels for longer periods.
* The lines with lower values of r exhibit lower peak accuracy and faster decline rates.
### Interpretation
The chart demonstrates the impact of parameters λ, μ, and r on the accuracy of a model or system over time. The parameters likely represent learning rates, regularization strengths, or other factors influencing the system's performance.
The initial increase in accuracy suggests a learning or adaptation phase, where the system improves its performance as it processes more data or experiences more iterations. The subsequent decline in accuracy for some lines may indicate overfitting, where the system becomes too specialized to the training data and loses its ability to generalize to new data.
The differences in peak accuracy and decline rates across the lines suggest that the optimal values of λ, μ, and r depend on the specific characteristics of the data and the desired trade-off between accuracy and generalization. The chart highlights the importance of carefully tuning these parameters to achieve optimal performance. The parameter 'r' appears to be a regularization parameter, as lower values of 'r' lead to higher initial accuracy but faster decline, suggesting a greater risk of overfitting. The parameters λ and μ likely control the rate and stability of the learning process, with higher values leading to faster initial learning but potentially less stable long-term performance.