## Confusion Matrix: LLM Prediction vs. Ground Truth
### Overview
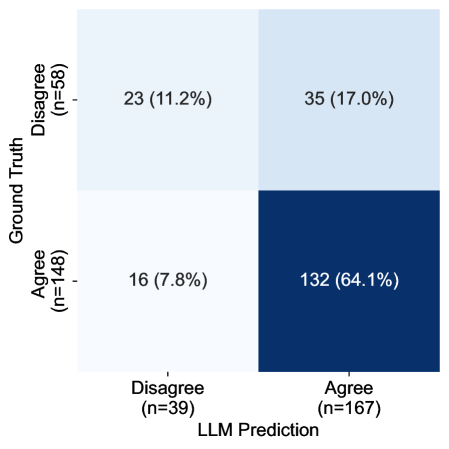
The image presents a 2x2 confusion matrix comparing LLM predictions against ground truth labels. The matrix evaluates agreement/disagreement classifications, with counts and percentages provided for each cell. The total sample size is 206 (n=58 for Disagree ground truth, n=148 for Agree ground truth).
### Components/Axes
- **Vertical Axis (Ground Truth):**
- "Disagree" (n=58)
- "Agree" (n=148)
- **Horizontal Axis (LLM Prediction):**
- "Disagree" (n=39)
- "Agree" (n=167)
- **Legend:** Located in the bottom-right corner. Light blue represents "Disagree," dark blue represents "Agree."
### Detailed Analysis
- **Top-Left Cell (Disagree GT vs. Disagree Pred):** 23 (11.2% of total sample)
- **Top-Right Cell (Disagree GT vs. Agree Pred):** 35 (17.0% of total sample)
- **Bottom-Left Cell (Agree GT vs. Disagree Pred):** 16 (7.8% of total sample)
- **Bottom-Right Cell (Agree GT vs. Agree Pred):** 132 (64.1% of total sample)
### Key Observations
1. **Prediction Bias:** The model shows a strong bias toward "Agree" predictions (64.1% of total predictions are Agree), despite the ground truth having a near-equal split (58 Disagree vs. 148 Agree).
2. **Accuracy Disparity:**
- For "Disagree" ground truth, the model correctly predicts 35/58 (60.3%) but misclassifies 23/58 (39.7%).
- For "Agree" ground truth, the model achieves 132/148 (89.2%) correct predictions but misclassifies 16/148 (10.8%).
3. **False Positives/Negatives:**
- 35 instances where the model incorrectly predicts "Agree" for "Disagree" ground truth.
- 16 instances where the model incorrectly predicts "Disagree" for "Agree" ground truth.
### Interpretation
The confusion matrix reveals a model with **high accuracy for "Agree" predictions** (89.2%) but **lower reliability for "Disagree" classifications** (60.3%). This suggests potential class imbalance issues, as the ground truth has more "Agree" instances (148 vs. 58). The model's tendency to favor "Agree" predictions could lead to overconfidence in positive outcomes, while underperforming on negative/neutral cases. The false positives (35) and false negatives (16) indicate areas for improvement in balancing precision and recall. The spatial distribution of errors (e.g., 17.0% of total predictions being incorrect "Agree" labels for "Disagree" ground truth) highlights the need for calibration to reduce over-optimism in predictions.