## Heatmap: Classification Accuracies
### Overview
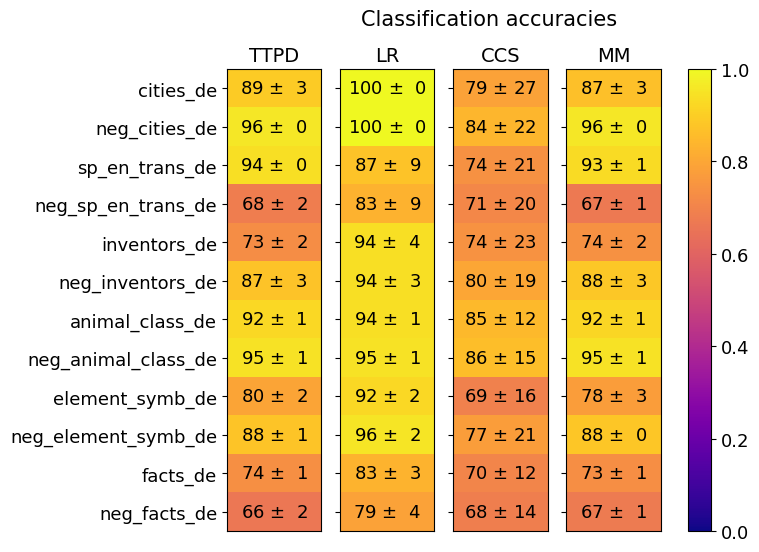
The image is a heatmap displaying the classification accuracies of four different models (TTPD, LR, CCS, and MM) across various categories. The color intensity represents the accuracy score, ranging from dark blue (low accuracy) to bright yellow (high accuracy). Each cell contains the accuracy score with an associated uncertainty value.
### Components/Axes
* **Title:** Classification accuracies
* **Columns (Models):** TTPD, LR, CCS, MM
* **Rows (Categories):**
* cities\_de
* neg\_cities\_de
* sp\_en\_trans\_de
* neg\_sp\_en\_trans\_de
* inventors\_de
* neg\_inventors\_de
* animal\_class\_de
* neg\_animal\_class\_de
* element\_symb\_de
* neg\_element\_symb\_de
* facts\_de
* neg\_facts\_de
* **Colorbar (Accuracy Scale):** Ranges from 0.0 (dark blue) to 1.0 (bright yellow), with intermediate values indicated.
### Detailed Analysis or ### Content Details
Here's a breakdown of the accuracy scores for each model and category:
* **TTPD:**
* cities\_de: 89 ± 3
* neg\_cities\_de: 96 ± 0
* sp\_en\_trans\_de: 94 ± 0
* neg\_sp\_en\_trans\_de: 68 ± 2
* inventors\_de: 73 ± 2
* neg\_inventors\_de: 87 ± 3
* animal\_class\_de: 92 ± 1
* neg\_animal\_class\_de: 95 ± 1
* element\_symb\_de: 80 ± 2
* neg\_element\_symb\_de: 88 ± 1
* facts\_de: 74 ± 1
* neg\_facts\_de: 66 ± 2
* **LR:**
* cities\_de: 100 ± 0
* neg\_cities\_de: 100 ± 0
* sp\_en\_trans\_de: 87 ± 9
* neg\_sp\_en\_trans\_de: 83 ± 9
* inventors\_de: 94 ± 4
* neg\_inventors\_de: 94 ± 3
* animal\_class\_de: 94 ± 1
* neg\_animal\_class\_de: 95 ± 1
* element\_symb\_de: 92 ± 2
* neg\_element\_symb\_de: 96 ± 2
* facts\_de: 83 ± 3
* neg\_facts\_de: 79 ± 4
* **CCS:**
* cities\_de: 79 ± 27
* neg\_cities\_de: 84 ± 22
* sp\_en\_trans\_de: 74 ± 21
* neg\_sp\_en\_trans\_de: 71 ± 20
* inventors\_de: 74 ± 23
* neg\_inventors\_de: 80 ± 19
* animal\_class\_de: 85 ± 12
* neg\_animal\_class\_de: 86 ± 15
* element\_symb\_de: 69 ± 16
* neg\_element\_symb\_de: 77 ± 21
* facts\_de: 70 ± 12
* neg\_facts\_de: 68 ± 14
* **MM:**
* cities\_de: 87 ± 3
* neg\_cities\_de: 96 ± 0
* sp\_en\_trans\_de: 93 ± 1
* neg\_sp\_en\_trans\_de: 67 ± 1
* inventors\_de: 74 ± 2
* neg\_inventors\_de: 88 ± 3
* animal\_class\_de: 92 ± 1
* neg\_animal\_class\_de: 95 ± 1
* element\_symb\_de: 78 ± 3
* neg\_element\_symb\_de: 88 ± 0
* facts\_de: 73 ± 1
* neg\_facts\_de: 67 ± 1
### Key Observations
* LR consistently achieves high accuracy, often reaching 100% for some categories.
* CCS generally has lower accuracy and higher uncertainty compared to the other models.
* The "neg\_sp\_en\_trans\_de" and "neg\_facts\_de" categories tend to have lower accuracy across all models.
* The "neg\_cities\_de" category has high accuracy for all models except CCS.
### Interpretation
The heatmap provides a visual comparison of the classification performance of four different models across a range of categories. The LR model appears to be the most accurate overall, while the CCS model struggles with higher uncertainty. The lower accuracy observed for "neg\_sp\_en\_trans\_de" and "neg\_facts\_de" suggests these categories may be more challenging to classify accurately. The high accuracy for "neg\_cities\_de" across most models indicates this category is relatively easy to classify. The uncertainty values provide insight into the variability of the model's performance.