## Heatmap: Classification Accuracies
### Overview
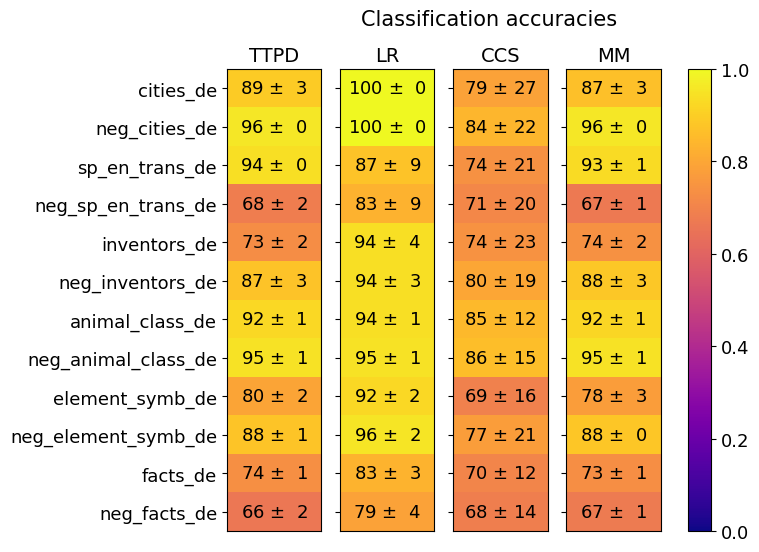
This image presents a heatmap displaying classification accuracies for various categories across four different models: TTPD, LR, CCS, and MM. The categories represent different types of text data, including cities, negative examples of cities, translations, inventors, animal classes, element symbols, and facts, all in the German language (indicated by the "_de" suffix). The heatmap uses a color gradient to represent accuracy, ranging from 0.0 (dark blue) to 1.0 (dark yellow). Each cell in the heatmap shows the accuracy value ± standard deviation.
### Components/Axes
* **Rows (Y-axis):** Represent the categories of text data. The categories are:
* cities_de
* neg_cities_de
* sp_en_trans_de (Spanish to English translations)
* neg_sp_en_trans_de (Negative examples of Spanish to English translations)
* inventors_de
* neg_inventors_de
* animal_class_de
* neg_animal_class_de
* element_symb_de
* neg_element_symb_de
* facts_de
* neg_facts_de
* **Columns (X-axis):** Represent the classification models:
* TTPD
* LR (Logistic Regression)
* CCS
* MM
* **Color Scale (Right):** Represents the classification accuracy, ranging from 0.0 (dark blue) to 1.0 (dark yellow).
* **Title:** "Classification accuracies" (centered at the top)
### Detailed Analysis
The heatmap displays accuracy values with standard deviations. Here's a breakdown of the data, row by row, and model by model:
* **cities_de:**
* TTPD: 89 ± 3
* LR: 100 ± 0
* CCS: 79 ± 27
* MM: 87 ± 3
* **neg_cities_de:**
* TTPD: 96 ± 0
* LR: 100 ± 0
* CCS: 84 ± 22
* MM: 96 ± 0
* **sp_en_trans_de:**
* TTPD: 94 ± 0
* LR: 87 ± 9
* CCS: 74 ± 21
* MM: 93 ± 1
* **neg_sp_en_trans_de:**
* TTPD: 68 ± 2
* LR: 83 ± 9
* CCS: 71 ± 20
* MM: 67 ± 1
* **inventors_de:**
* TTPD: 73 ± 2
* LR: 94 ± 4
* CCS: 74 ± 23
* MM: 74 ± 2
* **neg_inventors_de:**
* TTPD: 87 ± 3
* LR: 94 ± 3
* CCS: 80 ± 19
* MM: 88 ± 3
* **animal_class_de:**
* TTPD: 92 ± 1
* LR: 94 ± 1
* CCS: 85 ± 12
* MM: 92 ± 1
* **neg_animal_class_de:**
* TTPD: 95 ± 1
* LR: 95 ± 1
* CCS: 86 ± 15
* MM: 95 ± 1
* **element_symb_de:**
* TTPD: 80 ± 2
* LR: 92 ± 2
* CCS: 69 ± 16
* MM: 78 ± 3
* **neg_element_symb_de:**
* TTPD: 88 ± 1
* LR: 96 ± 2
* CCS: 72 ± 21
* MM: 88 ± 0
* **facts_de:**
* TTPD: 74 ± 1
* LR: 83 ± 3
* CCS: 70 ± 12
* MM: 73 ± 1
* **neg_facts_de:**
* TTPD: 66 ± 2
* LR: 79 ± 4
* CCS: 68 ± 14
* MM: 67 ± 1
### Key Observations
* **LR consistently performs well:** The Logistic Regression (LR) model achieves the highest accuracies across most categories, often reaching 100%.
* **Negative examples are generally easier to classify:** For most categories, the negative examples (e.g., `neg_cities_de`) have higher accuracy scores than their positive counterparts (e.g., `cities_de`).
* **CCS has the highest variance:** The CCS model exhibits the largest standard deviations in accuracy, indicating less consistent performance.
* **TTPD and MM are comparable:** TTPD and MM models show similar performance levels across the categories.
* **Low accuracy for 'neg_sp_en_trans_de' and 'neg_facts_de':** The negative examples for Spanish-English translations and facts have relatively lower accuracy scores across all models.
### Interpretation
The heatmap demonstrates the effectiveness of different classification models on various German text categories. The consistently high performance of the LR model suggests it is well-suited for these types of text classification tasks. The higher accuracy on negative examples could indicate that the features used for classification are more easily distinguishable in negative cases. The large variance in CCS performance suggests that this model is more sensitive to the specific data within each category. The lower accuracy for negative examples of translations and facts might indicate that these categories are more challenging to classify, potentially due to ambiguity or complexity in the text. The "_de" suffix consistently indicates that the data is in the German language. The use of "neg_" prefixes suggests the creation of negative datasets for training or evaluation, a common practice in machine learning to improve model robustness. The heatmap provides a clear visual comparison of model performance, allowing for informed decisions about which model to use for specific text classification applications.