## Heatmap: Classification accuracies
### Overview
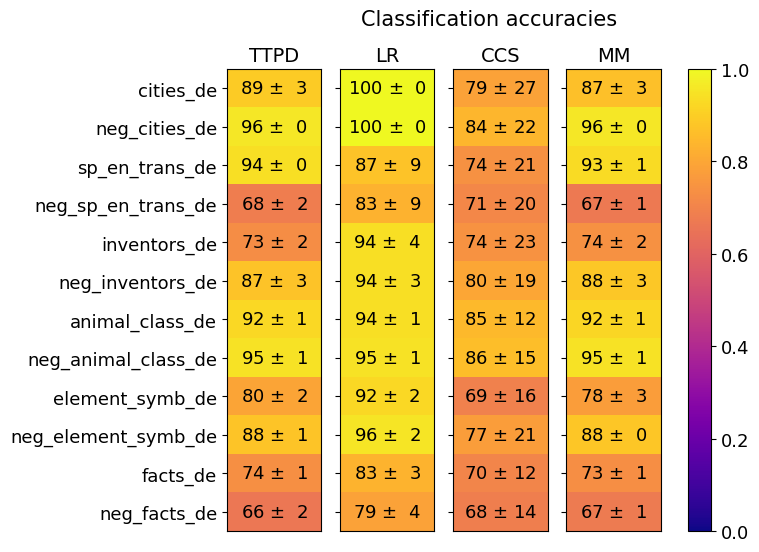
A heatmap visualizing classification accuracy across four methods (TTPD, LR, CCS, MM) for 12 categories. Accuracy values are represented by color intensity (yellow = highest, red = lowest) with numerical values and confidence intervals (± values) displayed in each cell.
### Components/Axes
- **X-axis (Methods)**: TTPD, LR, CCS, MM (left to right)
- **Y-axis (Categories)**:
1. cities_de
2. neg_cities_de
3. sp_en_trans_de
4. neg_sp_en_trans_de
5. inventors_de
6. neg_inventors_de
7. animal_class_de
8. neg_animal_class_de
9. element_symb_de
10. neg_element_symb_de
11. facts_de
12. neg_facts_de
- **Legend**: Color scale from 0.0 (purple) to 1.0 (yellow), with intermediate orange shades
- **Title**: "Classification accuracies" (top center)
### Detailed Analysis
#### Method Performance:
1. **LR (Logistic Regression)**:
- Highest accuracy across all categories (100 ± 0 in cities_de and neg_cities_de)
- Consistently top performer (94-100% range)
- Example: `animal_class_de` = 94 ± 1
2. **TTPD**:
- Strong performance (87-96% range)
- Notable: `cities_de` = 89 ± 3, `neg_cities_de` = 96 ± 0
3. **MM**:
- Competitive with TTPD (87-96% range)
- Example: `neg_inventors_de` = 88 ± 3
4. **CCS**:
- Lowest accuracy (68-86% range)
- High variability (e.g., `neg_facts_de` = 68 ± 14)
- Example: `sp_en_trans_de` = 74 ± 21
#### Confidence Intervals:
- **Low variability**: LR (0-4), MM (1-3), TTPD (1-3)
- **High variability**: CCS (12-27), particularly in `neg_facts_de` (±14)
### Key Observations
1. **LR Dominance**: Achieves perfect scores (100 ± 0) in two categories, with no negative accuracy deviations
2. **CCS Weakness**: Consistently lowest performance with largest confidence intervals (e.g., ±27 in `cities_de`)
3. **Color Correlation**: Yellow dominates LR cells, red/orange dominates CCS cells
4. **Symmetry**: Some categories show mirrored performance (e.g., `cities_de` vs `neg_cities_de`)
### Interpretation
The data demonstrates **LR as the most reliable classifier** across all categories, with perfect scores in critical domains like cities and neg_cities. **CCS shows significant underperformance** with high variability, suggesting potential issues with its classification logic or training data. The **± values** reveal that while LR maintains tight confidence intervals, CCS's wide ranges indicate unstable predictions. The heatmap's color gradient effectively visualizes these disparities, with LR's yellow dominance contrasting against CCS's red/orange tones. Notably, the `neg_facts_de` category shows the most pronounced CCS weakness (68 ± 14), potentially indicating domain-specific challenges.