\n
## Diagram: Transformation of Graph Structures
### Overview
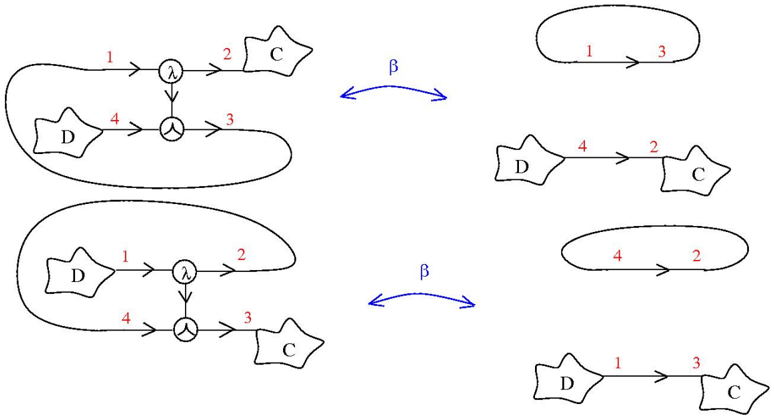
The image depicts two sets of graph transformations. Each set shows an initial complex graph structure being transformed into a simpler, linear structure via a process labeled "β". The graphs consist of nodes represented by shapes (circles and pentagons) and directed edges labeled with numerical values.
### Components/Axes
The diagram consists of the following components:
* **Nodes:** Represented by circles and pentagons. The pentagons are labeled "C" and "D". The circles are unlabeled, but appear to represent branching points.
* **Edges:** Directed lines connecting the nodes, labeled with the numbers 1, 2, 3, and 4.
* **Transformation Arrows:** Blue, curved arrows labeled "β" indicating the transformation process.
* **Enclosing Curves:** Red and blue curves that appear to delineate the initial and transformed graph structures.
### Detailed Analysis or Content Details
**First Transformation (Top):**
* **Initial Graph:** A central node (circle) has incoming edges labeled '1' from a pentagon 'D' and '2' from a pentagon 'C'. It has outgoing edges labeled '3' to a pentagon 'C' and '4' to a pentagon 'D'.
* **Transformed Graphs (Right):**
* A linear sequence with edges labeled '1' and '3'.
* A linear sequence with edges labeled '4' and '2'.
* A linear sequence with edges labeled '1' and '3', with 'D' and 'C' pentagons.
**Second Transformation (Bottom):**
* **Initial Graph:** A central node (circle) has incoming edges labeled '1' from a pentagon 'D' and '2' from a pentagon 'C'. It has outgoing edges labeled '3' to a pentagon 'C' and '4' to a pentagon 'D'. This is identical to the first initial graph.
* **Transformed Graphs (Right):**
* A linear sequence with edges labeled '4' and '2'.
* A linear sequence with edges labeled '1' and '3', with 'D' and 'C' pentagons.
### Key Observations
* The initial graph structure in both transformations is identical.
* The transformation "β" consistently breaks down the complex graph into simpler linear sequences.
* The edges are re-arranged, but the labels (1, 2, 3, 4) remain consistent throughout the transformation.
* The pentagons 'C' and 'D' are consistently present in the initial and transformed graphs.
### Interpretation
The diagram likely represents a decomposition or simplification process applied to a graph structure. The transformation "β" could represent a rule or algorithm that breaks down a complex network into simpler paths. The consistent labeling of the edges suggests that the transformation preserves the relationships between the nodes, even as the overall structure changes. The presence of 'C' and 'D' could indicate specific types of nodes or entities within the network.
The diagram demonstrates a potential method for reducing complexity in a graph by isolating specific pathways. The repetition of the initial graph and transformation suggests a general principle or rule being illustrated, rather than a specific instance. The transformation appears to separate the incoming and outgoing connections into distinct linear sequences. This could be a step in a larger process, such as pathfinding or network analysis. The enclosing curves may represent boundaries or scopes of the transformation.