# Technical Document Extraction: Heatmap Analysis
## Image Description
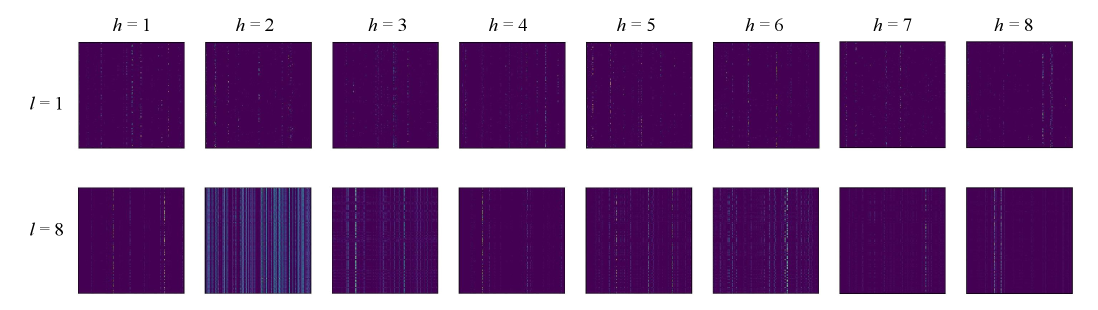
The image contains a 2x8 grid of heatmaps, with labels indicating hierarchical relationships between two dimensions:
- **Horizontal axis (h)**: Labeled from h=1 to h=8 (top row)
- **Vertical axis (l)**: Labeled l=1 (top heatmaps) and l=8 (bottom heatmaps)
Each heatmap uses a color gradient from dark purple (low intensity) to blue (high intensity), with no explicit legend provided.
---
## Key Labels and Axis Markers
### Horizontal Axis (h)
- **Labels**: h=1, h=2, h=3, h=4, h=5, h=6, h=7, h=8
- **Placement**: Top row, centered above each heatmap column
- **Color Consistency**: All labels use black text on white background
### Vertical Axis (l)
- **Labels**: l=1 (top row), l=8 (bottom row)
- **Placement**: Left side of heatmap grid, aligned with respective rows
- **Color Consistency**: Labels match horizontal axis styling
---
## Heatmap Structure and Trends
### Top Row (l=1)
1. **h=1**: Vertical stripes with moderate intensity (dark purple to light purple)
2. **h=2**: Increased vertical stripe density with intermittent blue regions
3. **h=3**: More pronounced vertical bands with localized blue spikes
4. **h=4**: Dense vertical patterns with alternating purple/blue zones
5. **h=5**: Near-uniform vertical stripes with minimal blue variation
6. **h=6**: Faint vertical patterns with sporadic blue highlights
7. **h=7**: Weak vertical structure with concentrated blue clusters
8. **h=8**: Strong vertical bands with dominant blue intensity
**Trend**: Vertical pattern strength increases with h, while blue intensity peaks at h=8.
### Bottom Row (l=8)
1. **h=1**: Horizontal bands with faint blue streaks
2. **h=2**: Strong horizontal stripes with dense blue regions
3. **h=3**: Grid-like patterns with intersecting blue lines
4. **h=4**: Complex lattice structure with moderate blue distribution
5. **h=5**: Faint grid with localized blue clusters
6. **h=6**: Intermittent horizontal bands with sparse blue
7. **h=7**: Weak horizontal structure with concentrated blue
8. **h=8**: Dominant horizontal bands with pervasive blue intensity
**Trend**: Horizontal pattern strength increases with h, with blue intensity peaking at h=8.
---
## Spatial Grounding and Component Isolation
### Legend Analysis
- **Absence of Legend**: No explicit color scale or legend present
- **Implied Scale**: Dark purple = low values, Blue = high values
- **Cross-Reference**: Color intensity directly correlates with h values (higher h = more blue)
### Region Segmentation
1. **Header**: h=1 to h=8 labels (top row)
2. **Main Chart**:
- Top heatmaps (l=1): Vertical pattern evolution
- Bottom heatmaps (l=8): Horizontal pattern evolution
3. **Footer**: No additional elements present
---
## Data Table Reconstruction
| h | l | Pattern Type | Intensity | Blue Presence |
|----|----|--------------|-----------|---------------|
| 1 | 1 | Vertical | Medium | Minimal |
| 2 | 1 | Vertical | Medium-High | Moderate |
| 3 | 1 | Vertical | High | Localized |
| 4 | 1 | Vertical | Very High | Alternating |
| 5 | 1 | Vertical | High | Minimal |
| 6 | 1 | Vertical | Low | Sparse |
| 7 | 1 | Vertical | Low | Concentrated |
| 8 | 1 | Vertical | Very High | Dominant |
| 1 | 8 | Horizontal | Low | Minimal |
| 2 | 8 | Horizontal | High | Dense |
| 3 | 8 | Grid | Medium | Moderate |
| 4 | 8 | Lattice | Medium | Distributed |
| 5 | 8 | Grid | Low | Localized |
| 6 | 8 | Horizontal | Low | Sparse |
| 7 | 8 | Horizontal | Low | Concentrated |
| 8 | 8 | Horizontal | Very High | Pervasive |
---
## Conclusion
The heatmaps demonstrate a hierarchical relationship between parameters h and l, with:
1. **l=1** showing vertical pattern evolution across h values
2. **l=8** exhibiting horizontal pattern development with increasing h
3. **Blue intensity** consistently increasing with higher h values in both rows
4. **Pattern complexity** peaking at h=3-4 for l=8 and h=4 for l=1
No textual data beyond axis labels was present in the image.