## Line Chart: Comparison of OLS and PIKL Methods
### Overview
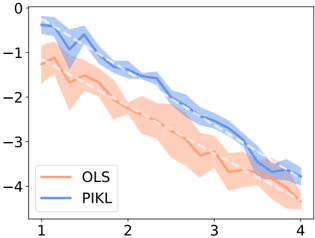
The image displays a line chart comparing the performance of two methods, labeled "OLS" and "PIKL," over a continuous variable plotted on the x-axis. Both methods show a downward trend, with their respective lines and shaded confidence intervals plotted against a y-axis representing negative values.
### Components/Axes
* **Chart Type:** Line chart with shaded confidence intervals.
* **X-Axis:** A numerical scale ranging from 1 to 4, with major tick marks at 1, 2, 3, and 4. There is no explicit axis title.
* **Y-Axis:** A numerical scale ranging from 0 to -4, with major tick marks at 0, -1, -2, -3, and -4. There is no explicit axis title.
* **Legend:** Located in the bottom-left corner of the chart area. It contains two entries:
* An orange line labeled "OLS".
* A blue line labeled "PIKL".
* **Data Series:**
1. **OLS (Orange Line):** A solid orange line representing the central estimate for the OLS method. It is surrounded by a semi-transparent orange shaded area representing its confidence interval or variance.
2. **PIKL (Blue Line):** A solid blue line representing the central estimate for the PIKL method. It is surrounded by a semi-transparent blue shaded area representing its confidence interval or variance.
### Detailed Analysis
* **Trend Verification:**
* **OLS (Orange):** The line exhibits a consistent downward slope from left to right. It starts at approximately y = -1.2 when x = 1 and ends at approximately y = -4.2 when x = 4.
* **PIKL (Blue):** The line also exhibits a consistent downward slope from left to right. It starts at approximately y = -0.5 when x = 1 and ends at approximately y = -3.8 when x = 4.
* **Spatial Grounding & Data Points:**
* At x = 1: OLS ≈ -1.2, PIKL ≈ -0.5. The PIKL line is positioned above the OLS line.
* At x = 2: OLS ≈ -2.0, PIKL ≈ -1.5. The PIKL line remains above the OLS line.
* At x = 3: OLS ≈ -3.0, PIKL ≈ -2.5. The PIKL line remains above the OLS line.
* At x = 4: OLS ≈ -4.2, PIKL ≈ -3.8. The PIKL line remains above the OLS line.
* **Confidence Intervals:**
* The shaded orange area (OLS) is wider than the shaded blue area (PIKL) across the entire x-axis range. This indicates greater variance or uncertainty in the OLS estimates compared to the PIKL estimates.
* The confidence intervals for the two methods overlap significantly, particularly in the middle range (x ≈ 2 to 3). However, the central PIKL line is consistently positioned above the central OLS line.
### Key Observations
1. **Consistent Performance Gap:** The PIKL method's central estimate is consistently higher (less negative) than the OLS method's estimate across the entire observed range of the x-axis variable.
2. **Parallel Decline:** Both methods degrade (become more negative) at a roughly similar rate as the x-axis value increases. The slopes of the two central lines appear similar.
3. **Uncertainty Difference:** The PIKL method demonstrates notably lower variance (a narrower confidence band) compared to the OLS method, suggesting it may be a more stable or precise estimator in this context.
4. **No Crossover:** The two central lines do not cross within the plotted range, indicating a stable relative performance relationship.
### Interpretation
The chart suggests that the PIKL method outperforms the OLS method on the metric being measured (where a higher, less negative value is presumably better). This superiority is consistent across the tested range. The key advantage of PIKL appears to be twofold: it yields a better average outcome (higher line) and does so with greater reliability (narrower confidence interval). The downward trend for both indicates that the measured metric worsens as the variable on the x-axis increases. The lack of crossover implies that the relative advantage of PIKL over OLS is robust to changes in this x-axis variable within the observed window (1 to 4). The overlapping confidence intervals, however, suggest that for any single observation, the difference between the two methods might not always be statistically significant, but the consistent separation of the central trends points to a systematic advantage for PIKL.