## Line Chart: Comparison of OLS and PIKL Trends
### Overview
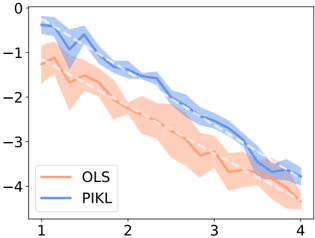
The image depicts a line chart comparing two data series labeled "OLS" (orange) and "PIKL" (blue) across an x-axis range of 1 to 4. Both lines exhibit downward trends, with shaded regions indicating variability or confidence intervals. The y-axis ranges from -4 to 0, with no explicit units provided.
### Components/Axes
- **X-axis**: Labeled with integer values 1, 2, 3, 4 (no explicit title).
- **Y-axis**: Labeled with values -4, -3, -2, -1, 0 (no explicit title).
- **Legend**: Located in the bottom-left corner, with:
- **OLS**: Orange line with a dashed white boundary.
- **PIKL**: Blue line with a dashed white boundary.
- **Shaded Regions**:
- Orange shading for OLS (±~0.5 units around the line).
- Blue shading for PIKL (±~0.7 units around the line).
### Detailed Analysis
1. **OLS (Orange Line)**:
- Starts near **y = -1** at x = 1.
- Decreases steadily to **y = -4** at x = 4.
- Shaded region widens slightly between x = 2 and x = 3, suggesting increased variability in this range.
2. **PIKL (Blue Line)**:
- Starts near **y = -1.5** at x = 1.
- Decreases more steeply to **y = -4.5** at x = 4.
- Shaded region is consistently wider than OLS, with notable variability spikes at x = 2 and x = 3.
### Key Observations
- Both lines show a **monotonic downward trend**, but PIKL declines faster.
- PIKL consistently lies **below OLS** across all x-values.
- The shaded regions for PIKL are **~30% wider** than OLS, indicating higher uncertainty or variability.
- At x = 4, PIKL reaches **-4.5**, exceeding the y-axis lower bound of -4, suggesting potential extrapolation or data truncation.
### Interpretation
The chart suggests a comparison of two methodologies (OLS and PIKL) where PIKL exhibits:
1. **Greater sensitivity** to changes in the x-axis variable (steeper decline).
2. **Higher inherent variability** (wider confidence intervals), possibly due to:
- Noisier data inputs.
- Less robust modeling assumptions.
3. **Convergence at x = 4**: Both lines approach similar y-values, though PIKL remains marginally lower. This could imply that while PIKL starts with a stronger initial effect, its performance stabilizes relative to OLS at higher x-values.
The absence of axis titles limits contextual interpretation, but the relative trends highlight trade-offs between stability (OLS) and responsiveness (PIKL). The shaded regions emphasize the importance of considering uncertainty in predictive models.