## Scatter Plot Matrix: Facilitation vs. AIE Score for Various Semantic Tasks
### Overview
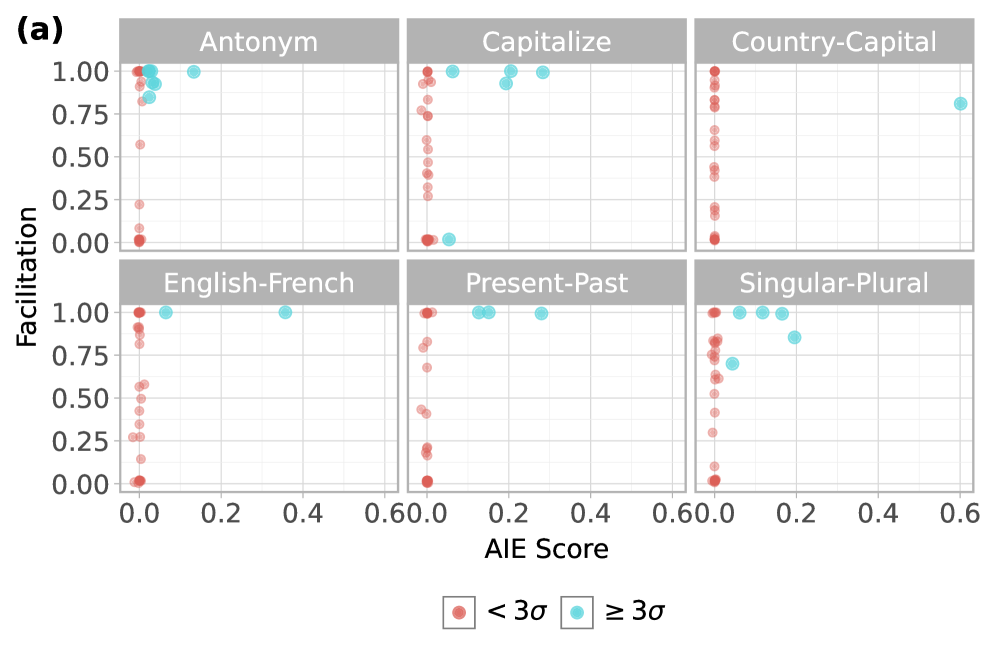
The image presents a scatter plot matrix displaying the relationship between "Facilitation" and "AIE Score" for six different semantic tasks: Antonym, Capitalize, Country-Capital, English-French, Present-Past, and Singular-Plural. Each task has its own scatter plot, with data points colored based on whether they are less than 3 standard deviations (< 3σ, red) or greater than or equal to 3 standard deviations (≥ 3σ, cyan).
### Components/Axes
* **Title:** (a)
* **X-axis (AIE Score):** Ranges from 0.0 to 0.6 in each subplot. Increments of 0.2.
* **Y-axis (Facilitation):** Ranges from 0.00 to 1.00 in each subplot. Increments of 0.25.
* **Subplot Titles:** Antonym, Capitalize, Country-Capital, English-French, Present-Past, Singular-Plural.
* **Legend (bottom):**
* Red circles: "< 3σ"
* Cyan circles: "≥ 3σ"
### Detailed Analysis
**1. Antonym**
* Trend: Most red points are clustered at low AIE scores (around 0.0) and varying Facilitation scores. Cyan points are clustered at low AIE scores (around 0.0) and high Facilitation scores (around 1.0).
* Data Points:
* Red points: AIE Score ~0.0, Facilitation ranges from ~0.0 to ~1.0.
* Cyan points: AIE Score ~0.0, Facilitation ~1.0.
**2. Capitalize**
* Trend: Most red points are clustered at higher AIE scores (around 0.6) and varying Facilitation scores. Cyan points are clustered at higher AIE scores (around 0.6) and high Facilitation scores (around 1.0).
* Data Points:
* Red points: AIE Score ~0.6, Facilitation ranges from ~0.0 to ~1.0.
* Cyan points: AIE Score ~0.6, Facilitation ~1.0.
**3. Country-Capital**
* Trend: Most red points are clustered at higher AIE scores (around 0.6) and varying Facilitation scores. One cyan point is at a higher AIE score (around 0.6) and a Facilitation score of around 0.8.
* Data Points:
* Red points: AIE Score ~0.6, Facilitation ranges from ~0.0 to ~1.0.
* Cyan points: AIE Score ~0.6, Facilitation ~0.8.
**4. English-French**
* Trend: Most red points are clustered at low AIE scores (around 0.0) and varying Facilitation scores. Two cyan points, one at low AIE scores (around 0.0) and one at a medium AIE score (around 0.4), both with high Facilitation scores (around 1.0).
* Data Points:
* Red points: AIE Score ~0.0, Facilitation ranges from ~0.0 to ~1.0.
* Cyan points: AIE Score ~0.0 and ~0.4, Facilitation ~1.0.
**5. Present-Past**
* Trend: Most red points are clustered at higher AIE scores (around 0.6) and varying Facilitation scores. Two cyan points, one at a low AIE score (around 0.0) and one at a medium AIE score (around 0.2), both with high Facilitation scores (around 1.0).
* Data Points:
* Red points: AIE Score ~0.6, Facilitation ranges from ~0.0 to ~1.0.
* Cyan points: AIE Score ~0.0 and ~0.2, Facilitation ~1.0.
**6. Singular-Plural**
* Trend: Most red points are clustered at higher AIE scores (around 0.6) and varying Facilitation scores. Several cyan points are clustered at low AIE scores (around 0.0) and high Facilitation scores (around 1.0).
* Data Points:
* Red points: AIE Score ~0.6, Facilitation ranges from ~0.0 to ~1.0.
* Cyan points: AIE Score ~0.0, Facilitation ~1.0.
### Key Observations
* For all tasks, the red points (< 3σ) are generally spread across a wider range of Facilitation scores, while the cyan points (≥ 3σ) tend to cluster at higher Facilitation scores.
* The AIE scores are clustered at either low (around 0.0) or high (around 0.6) values, with fewer points in the intermediate range.
* The tasks "Antonym", "English-French", and "Singular-Plural" have cyan points clustered at low AIE scores, while "Capitalize", "Country-Capital", and "Present-Past" have cyan points at higher AIE scores.
### Interpretation
The scatter plot matrix suggests a relationship between AIE Score, Facilitation, and the specific semantic task. Higher Facilitation scores tend to be associated with data points that are greater than or equal to 3 standard deviations from the mean. The clustering of AIE scores at either low or high values could indicate distinct processing strategies or task characteristics. The differences in AIE score distribution for different tasks may reflect varying levels of cognitive effort or complexity required for each task. The data suggests that the "Antonym", "English-French", and "Singular-Plural" tasks are facilitated at lower AIE scores, while "Capitalize", "Country-Capital", and "Present-Past" are facilitated at higher AIE scores.