## Scatter Plots: Facilitation vs. AIE Score for Linguistic Relationships
### Overview
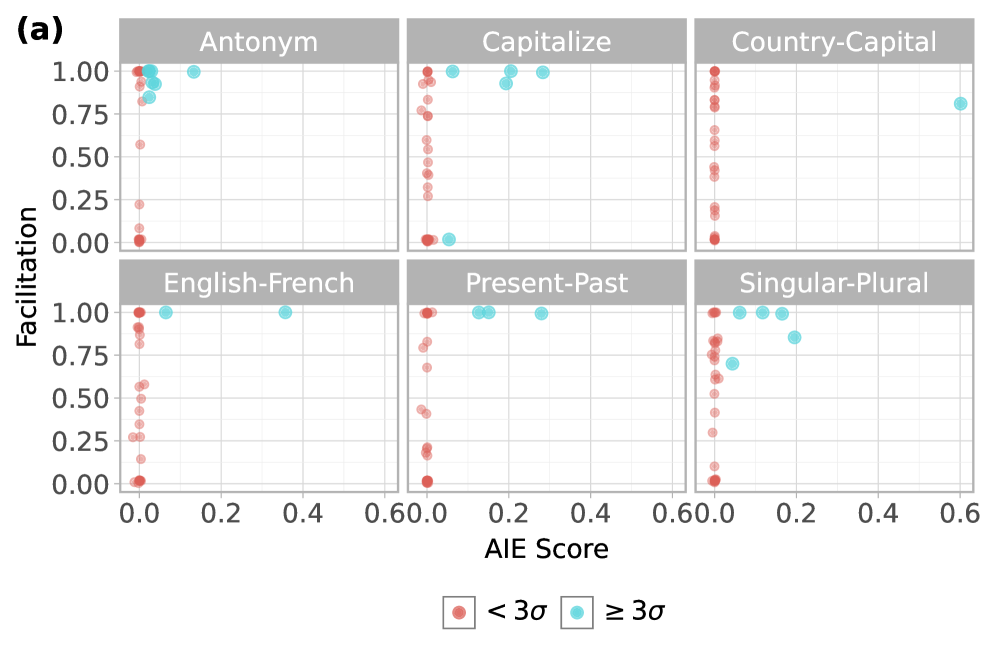
The image presents six scatter plots arranged in a 2x3 grid. Each plot visualizes the relationship between "Facilitation" (y-axis) and "AIE Score" (x-axis) for a specific linguistic relationship. Data points are color-coded to indicate statistical significance (less than 3 standard deviations vs. greater than or equal to 3 standard deviations). The plots are labeled with the corresponding linguistic relationship.
### Components/Axes
* **X-axis:** "AIE Score" ranging from 0.0 to 0.6.
* **Y-axis:** "Facilitation" ranging from 0.00 to 1.00.
* **Plots (arranged in a 2x3 grid):**
1. Antonym
2. Capitalize
3. Country-Capital
4. English-French
5. Present-Past
6. Singular-Plural
* **Legend (bottom-left):**
* Red circles: "< 3σ" (less than 3 standard deviations)
* Blue circles: "≥ 3σ" (greater than or equal to 3 standard deviations)
* **Title:** "(a)" in the top-left corner.
### Detailed Analysis or Content Details
**1. Antonym:**
* Trend: The data points generally cluster towards the left side of the plot (low AIE scores) with a mix of facilitation values.
* Data Points:
* Approximately 8 red points (< 3σ) with AIE scores ranging from 0.0 to 0.2 and facilitation values ranging from 0.0 to 1.0.
* Approximately 2 blue points (≥ 3σ) with AIE scores around 0.6 and facilitation values around 0.9.
**2. Capitalize:**
* Trend: The data points are concentrated on the right side of the plot (high AIE scores) with facilitation values clustered around 0.0.
* Data Points:
* Approximately 9 red points (< 3σ) with AIE scores ranging from 0.4 to 0.6 and facilitation values ranging from 0.0 to 0.2.
* Approximately 1 blue point (≥ 3σ) with AIE score around 0.6 and facilitation value around 0.1.
**3. Country-Capital:**
* Trend: Data points are scattered, with a slight concentration towards the right side (higher AIE scores).
* Data Points:
* Approximately 7 red points (< 3σ) with AIE scores ranging from 0.0 to 0.6 and facilitation values ranging from 0.0 to 1.0.
* Approximately 3 blue points (≥ 3σ) with AIE scores around 0.6 and facilitation values around 0.8.
**4. English-French:**
* Trend: The data points are concentrated on the left side of the plot (low AIE scores) with facilitation values ranging from 0.0 to 1.0.
* Data Points:
* Approximately 8 red points (< 3σ) with AIE scores ranging from 0.0 to 0.2 and facilitation values ranging from 0.0 to 1.0.
* Approximately 2 blue points (≥ 3σ) with AIE scores around 0.6 and facilitation values around 0.9.
**5. Present-Past:**
* Trend: Data points are concentrated on the right side of the plot (high AIE scores) with facilitation values clustered around 0.0.
* Data Points:
* Approximately 8 red points (< 3σ) with AIE scores ranging from 0.4 to 0.6 and facilitation values ranging from 0.0 to 0.2.
* Approximately 2 blue points (≥ 3σ) with AIE score around 0.6 and facilitation value around 0.1.
**6. Singular-Plural:**
* Trend: The data points are scattered, with a slight concentration towards the right side (higher AIE scores).
* Data Points:
* Approximately 7 red points (< 3σ) with AIE scores ranging from 0.0 to 0.6 and facilitation values ranging from 0.0 to 1.0.
* Approximately 3 blue points (≥ 3σ) with AIE scores around 0.6 and facilitation values around 0.8.
### Key Observations
* The "Capitalize" and "Present-Past" plots show a negative correlation between AIE Score and Facilitation. As AIE Score increases, Facilitation tends to decrease.
* The "Antonym", "English-French", "Country-Capital" and "Singular-Plural" plots show a positive correlation between AIE Score and Facilitation. As AIE Score increases, Facilitation tends to increase.
* The blue data points (≥ 3σ) are relatively sparse, suggesting that strong statistical significance is not common across these relationships.
* The red data points (< 3σ) dominate each plot, indicating that most of the observed facilitation effects are within the expected range of statistical variation.
### Interpretation
The plots explore the relationship between AIE (Artificial Intelligence Experiment) Score and Facilitation for different linguistic relationships. AIE Score likely represents a measure of how easily an AI system can process or understand the relationship, while Facilitation represents how much the relationship aids human processing.
The negative correlation observed in "Capitalize" and "Present-Past" suggests that as AI systems become better at processing these relationships (higher AIE Score), they provide less facilitation for human processing. This could be because these relationships are relatively simple and humans don't require much assistance once the AI has mastered them.
The positive correlation observed in "Antonym", "English-French", "Country-Capital" and "Singular-Plural" suggests that as AI systems become better at processing these relationships (higher AIE Score), they provide more facilitation for human processing. This could be because these relationships are more complex and humans benefit from the AI's assistance.
The scarcity of statistically significant data points (blue circles) suggests that the observed facilitation effects are often weak and may not be robust. The dominance of non-significant data points (red circles) indicates that the relationships are often subtle and may be influenced by other factors.