## Diagram: Saddle Point vs. Minimum
### Overview
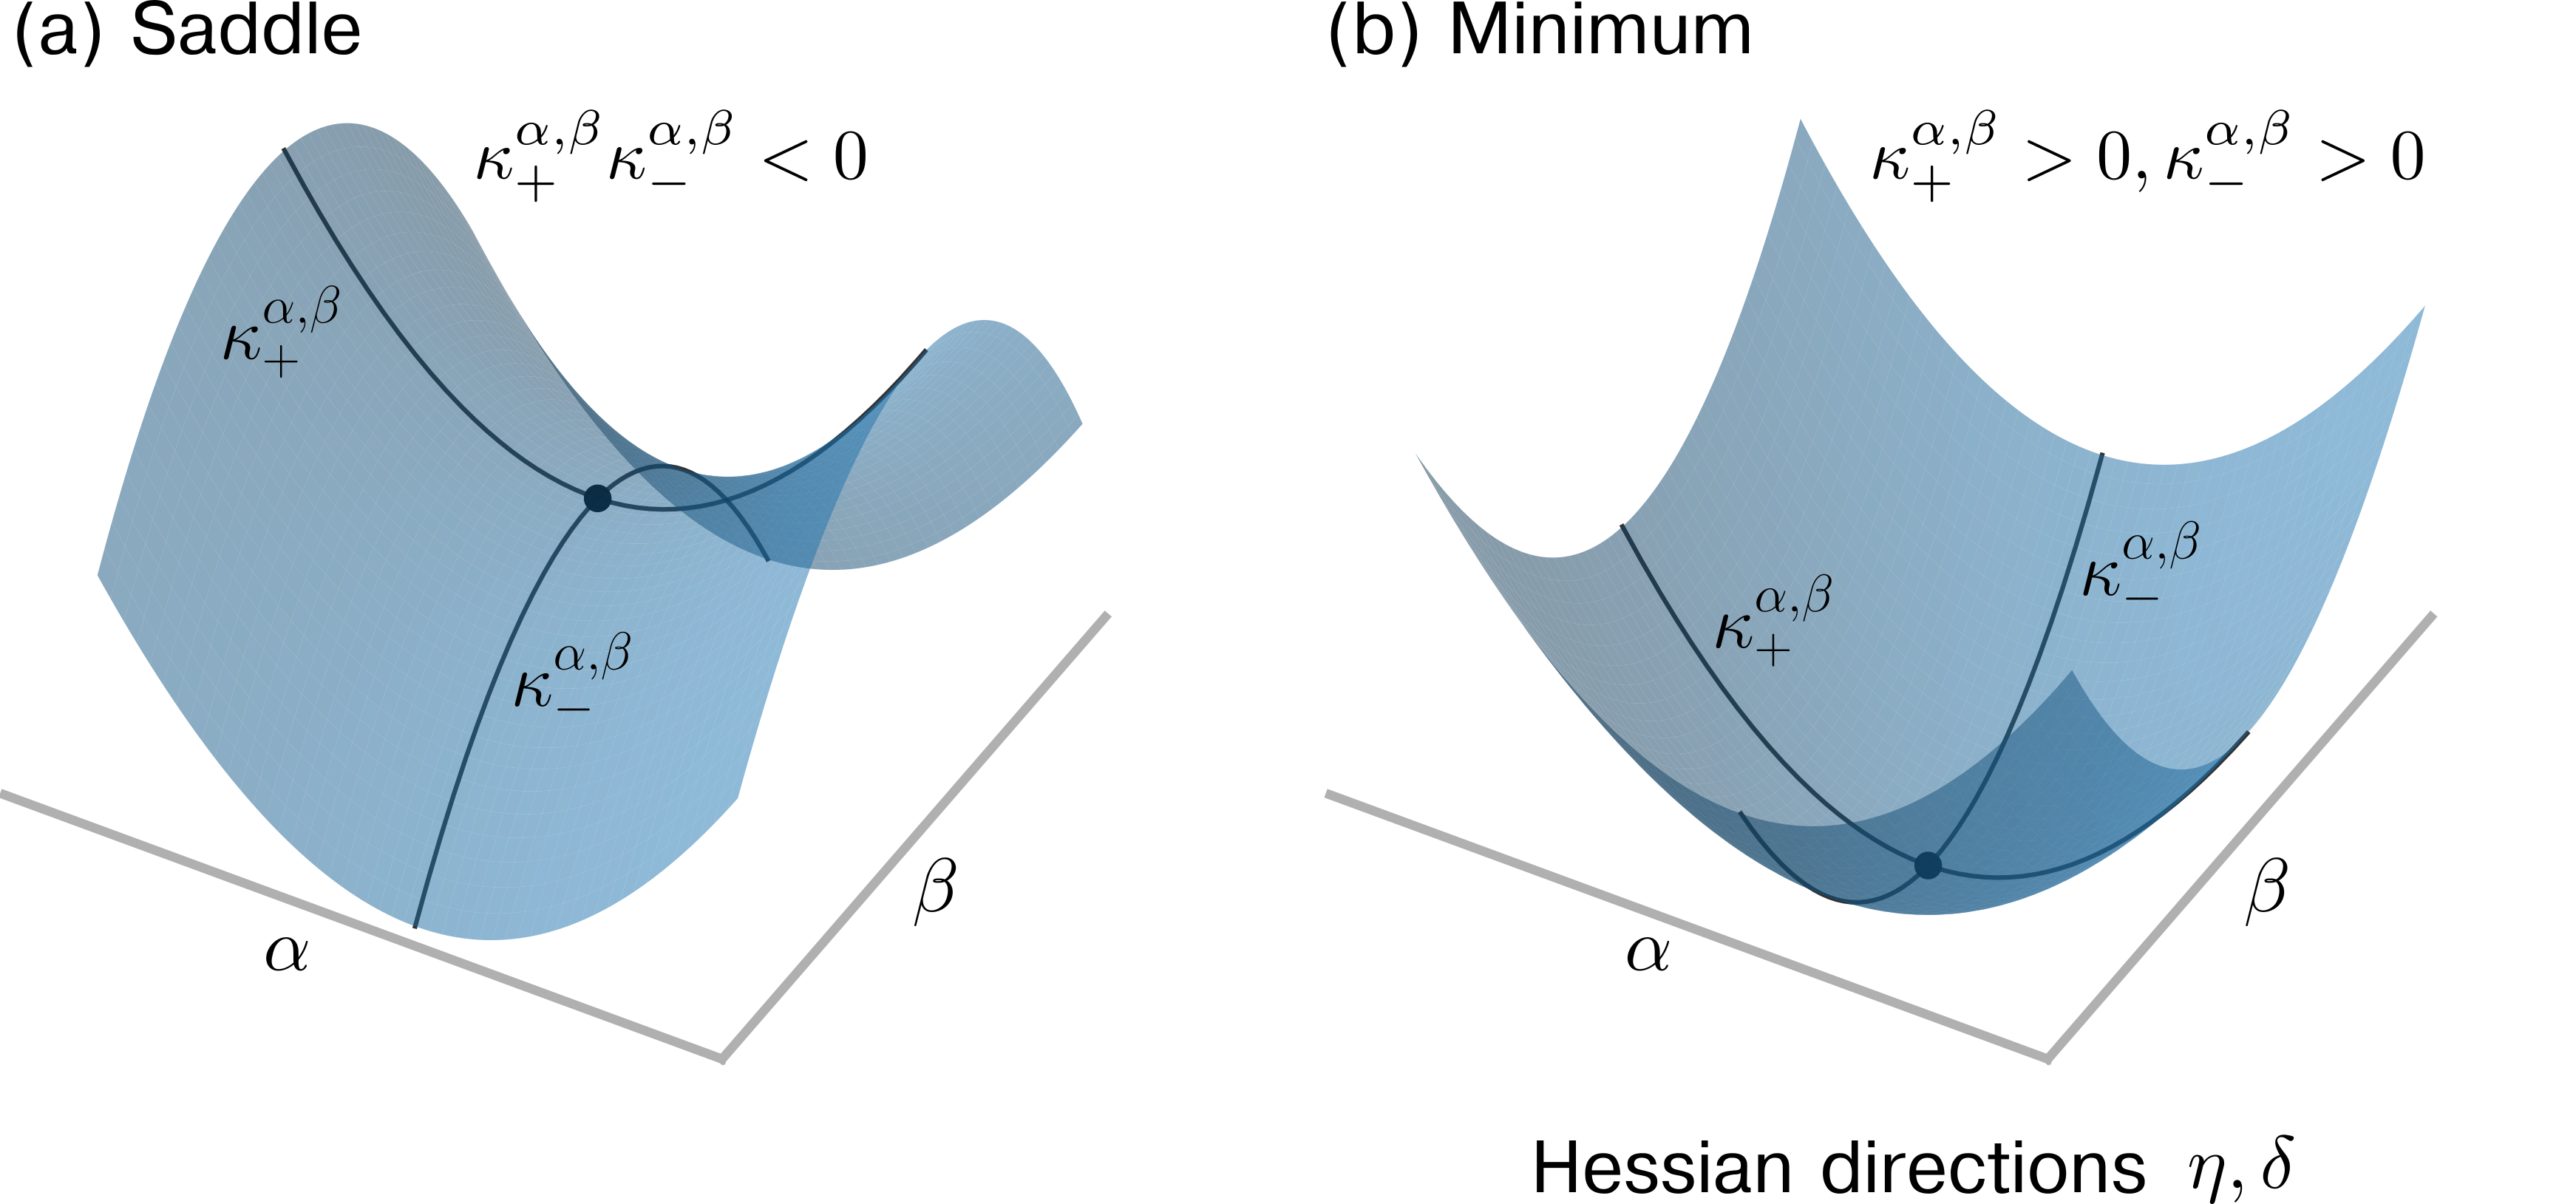
The image presents two 3D diagrams illustrating the concepts of a saddle point and a minimum in a two-dimensional space defined by parameters alpha (α) and beta (β). Each diagram shows a surface representing a function's value over the α-β plane, along with curves indicating the Hessian directions.
### Components/Axes
* **Axes:** The diagrams have two axes labeled α and β, representing the two parameters. The vertical axis implicitly represents the function's value.
* **Surface:** A blue-shaded surface represents the function's value over the α-β plane. The surface has a grid on it.
* **Hessian Directions:** Two dark blue curves on each surface indicate the Hessian directions. These are labeled as κ₊^(α,β) and κ₋^(α,β).
* **Critical Point:** A dark blue dot marks the critical point (where the gradient is zero) on each surface.
* **Titles:** The diagrams are titled "(a) Saddle" and "(b) Minimum".
* **Conditions:** Above each diagram, conditions are stated regarding the curvatures:
* Saddle: κ₊^(α,β) * κ₋^(α,β) < 0
* Minimum: κ₊^(α,β) > 0, κ₋^(α,β) > 0
* **Footer:** "Hessian directions η, δ"
### Detailed Analysis
**Diagram (a): Saddle**
* The surface has a saddle shape, with a minimum along one direction and a maximum along another.
* The critical point is located at the saddle point.
* The curve labeled κ₊^(α,β) rises away from the saddle point.
* The curve labeled κ₋^(α,β) descends away from the saddle point.
* The condition κ₊^(α,β) * κ₋^(α,β) < 0 indicates that the product of the curvatures along the two Hessian directions is negative, which is characteristic of a saddle point.
**Diagram (b): Minimum**
* The surface has a bowl shape, indicating a minimum.
* The critical point is located at the minimum.
* Both curves labeled κ₊^(α,β) and κ₋^(α,β) rise away from the minimum.
* The condition κ₊^(α,β) > 0, κ₋^(α,β) > 0 indicates that the curvatures along both Hessian directions are positive, which is characteristic of a minimum.
### Key Observations
* The diagrams visually represent the difference between a saddle point and a minimum based on the shape of the surface and the curvatures along the Hessian directions.
* The conditions stated above each diagram mathematically define the nature of the critical point.
### Interpretation
The image illustrates how the Hessian matrix (specifically, the curvatures along the Hessian directions) can be used to classify critical points of a function. A saddle point occurs when the curvatures have opposite signs (one positive, one negative), while a minimum occurs when both curvatures are positive. This is a fundamental concept in optimization and calculus, used to find and characterize extrema of functions. The Hessian directions η, δ are the eigenvectors of the Hessian matrix, indicating the directions of maximum and minimum curvature.