\n
## Diagram: LLM Fine-Tuning and DFS Inference
### Overview
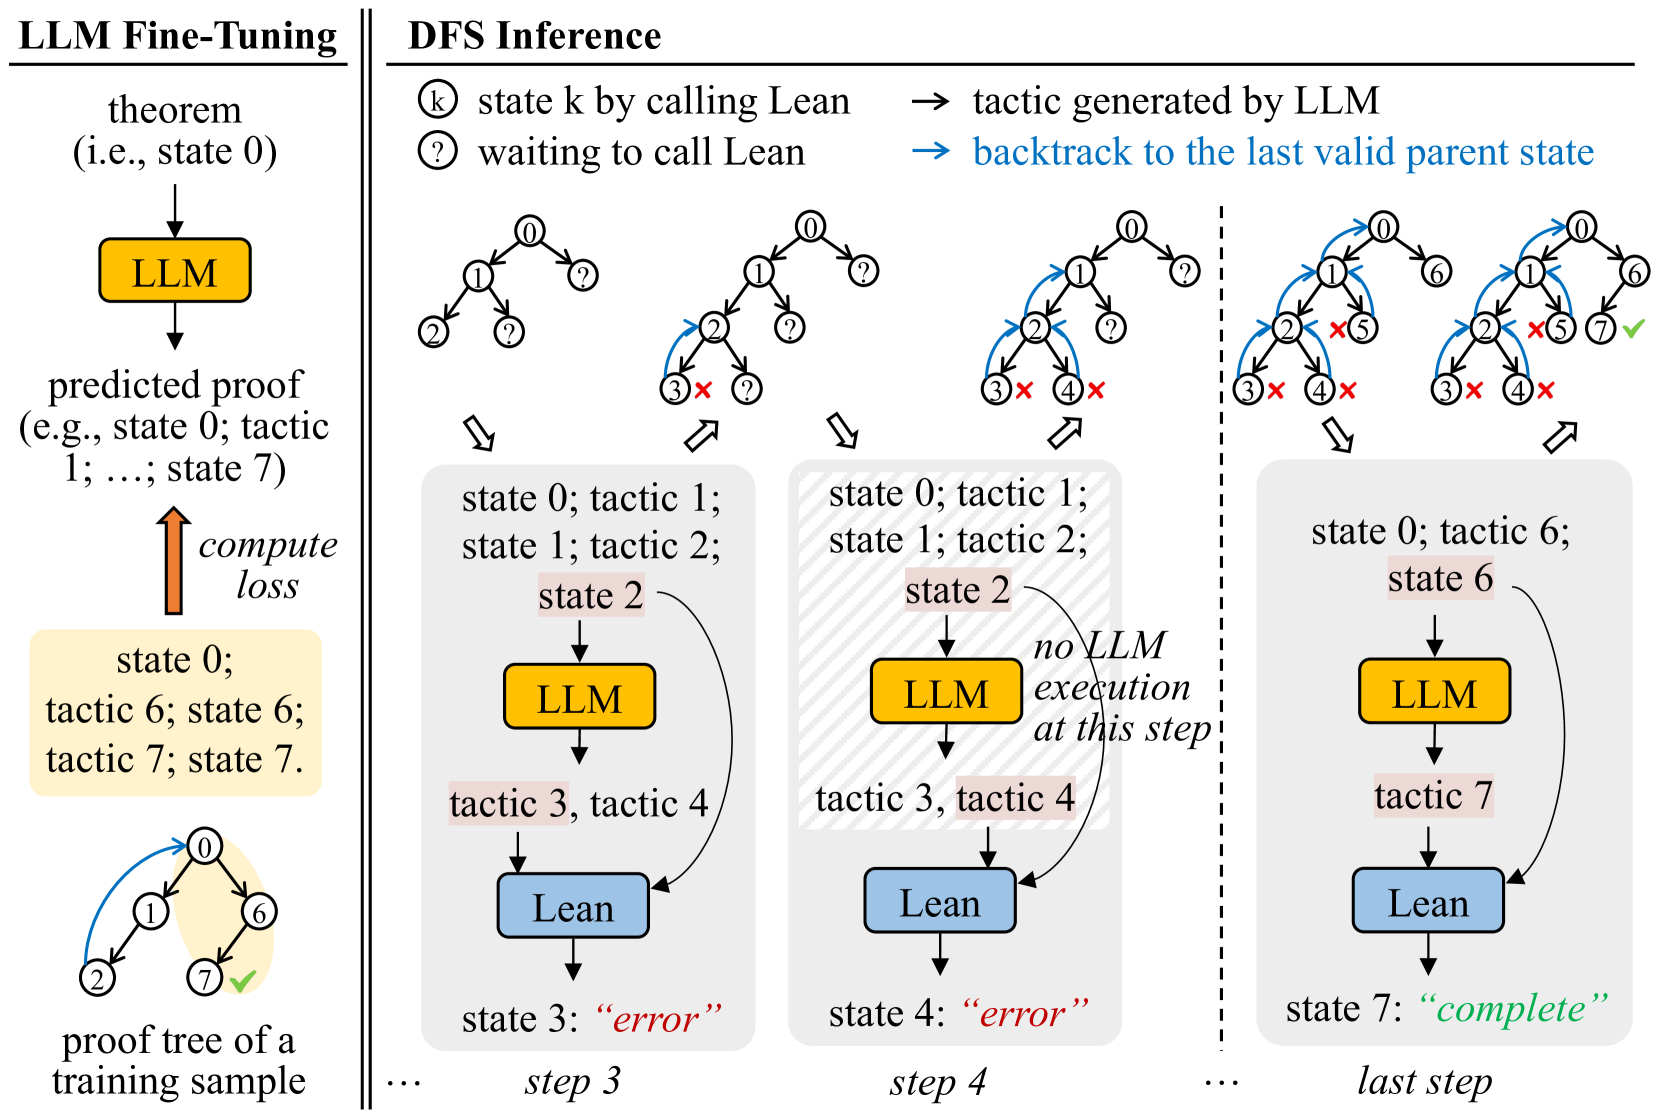
The image is a diagram illustrating the process of LLM (Large Language Model) fine-tuning alongside Depth-First Search (DFS) inference. It depicts a feedback loop for fine-tuning and a step-by-step progression of DFS inference, showing interactions between the LLM and a Lean theorem prover. The diagram is divided into two main sections: "LLM Fine-Tuning" on the left and "DFS Inference" on the right.
### Components/Axes
The diagram uses several components:
* **LLM:** Represented by a rounded rectangle, colored light green.
* **Lean:** Represented by a rounded rectangle, colored dark green.
* **Theorem:** Represented as a text label.
* **Predicted Proof:** Represented as a text label.
* **State:** Represented as a text label, indicating the current state of the proof.
* **Tactic:** Represented as a text label, indicating the tactic applied.
* **Arrows:** Indicate the flow of information and actions.
* **Circles with Numbers:** Represent states in the DFS search tree.
* **Circles with Question Marks:** Represent states waiting for a call to Lean.
* **Circles with X's:** Represent states that resulted in an error.
* **Key:** Explains the meaning of the circle symbols.
### Detailed Analysis or Content Details
**LLM Fine-Tuning (Left Side):**
* **Theorem (i.e., state 0):** Input to the LLM.
* **LLM:** Processes the theorem and generates a predicted proof.
* **Predicted Proof (e.g., state 0; tactic 1; ..., state 7):** The output of the LLM.
* **Compute Loss:** A red arrow indicates the computation of loss based on the predicted proof.
* **State 0; tactic 6; tactic 7; state 7:** The final state after applying tactics.
* **Proof tree of a training sample:** The final output of the fine-tuning process.
**DFS Inference (Right Side):**
The DFS inference is shown in three steps: step 3, step 4, and "last step".
* **Step 3:**
* **State 0; tactic 1; state 1; tactic 2; state 2:** Initial states and tactics.
* **LLM:** Generates tactic 3, tactic 4.
* **Lean:** Processes the tactics and returns "error" in state 3.
* **Step 4:**
* **State 0; tactic 1; state 1; tactic 2; state 2:** Initial states and tactics.
* **LLM:** Generates tactic 3, tactic 4. A note indicates "no LLM execution at this step".
* **Lean:** Processes the tactics and returns "error" in state 4.
* **Last Step:**
* **State 0; tactic 6; state 6:** Initial states and tactics.
* **LLM:** Generates tactic 7.
* **Lean:** Processes the tactic and returns "complete" in state 7.
**Key:**
* **k:** state k by calling Lean -> tactic generated by LLM
* **?:** waiting to call Lean -> backtrack to the last valid parent state
**DFS Tree Visualization:**
Each step shows a tree-like structure with numbered nodes representing states. The arrows indicate the progression of the search. Nodes marked with an "X" indicate states that led to an error and were backtracked from.
### Key Observations
* The LLM generates tactics that are then evaluated by Lean.
* The process involves backtracking when Lean returns an error.
* The fine-tuning loop aims to minimize the loss by adjusting the LLM's tactic generation.
* The DFS inference explores different proof paths until a "complete" state is reached.
* The diagram highlights the iterative nature of both fine-tuning and inference.
### Interpretation
The diagram illustrates a reinforcement learning-like approach to training an LLM for theorem proving. The LLM proposes tactics, Lean verifies them, and the resulting feedback (success or error) is used to refine the LLM's strategy. The DFS inference demonstrates how the LLM explores the space of possible proofs, guided by Lean's feedback. The "no LLM execution at this step" note in step 4 suggests a potential optimization or a scenario where the LLM's output is already known or cached. The diagram emphasizes the interplay between the LLM's generative capabilities and Lean's formal verification, showcasing a hybrid approach to automated theorem proving. The iterative nature of the process suggests that the LLM learns to generate more effective tactics over time, leading to more successful proof attempts. The diagram is a high-level conceptual overview and doesn't provide specific numerical data or performance metrics. It focuses on the flow of information and the key components involved in the process.