\n
## Scatter Plot: Reasoning Tokens vs. Problem Size
### Overview
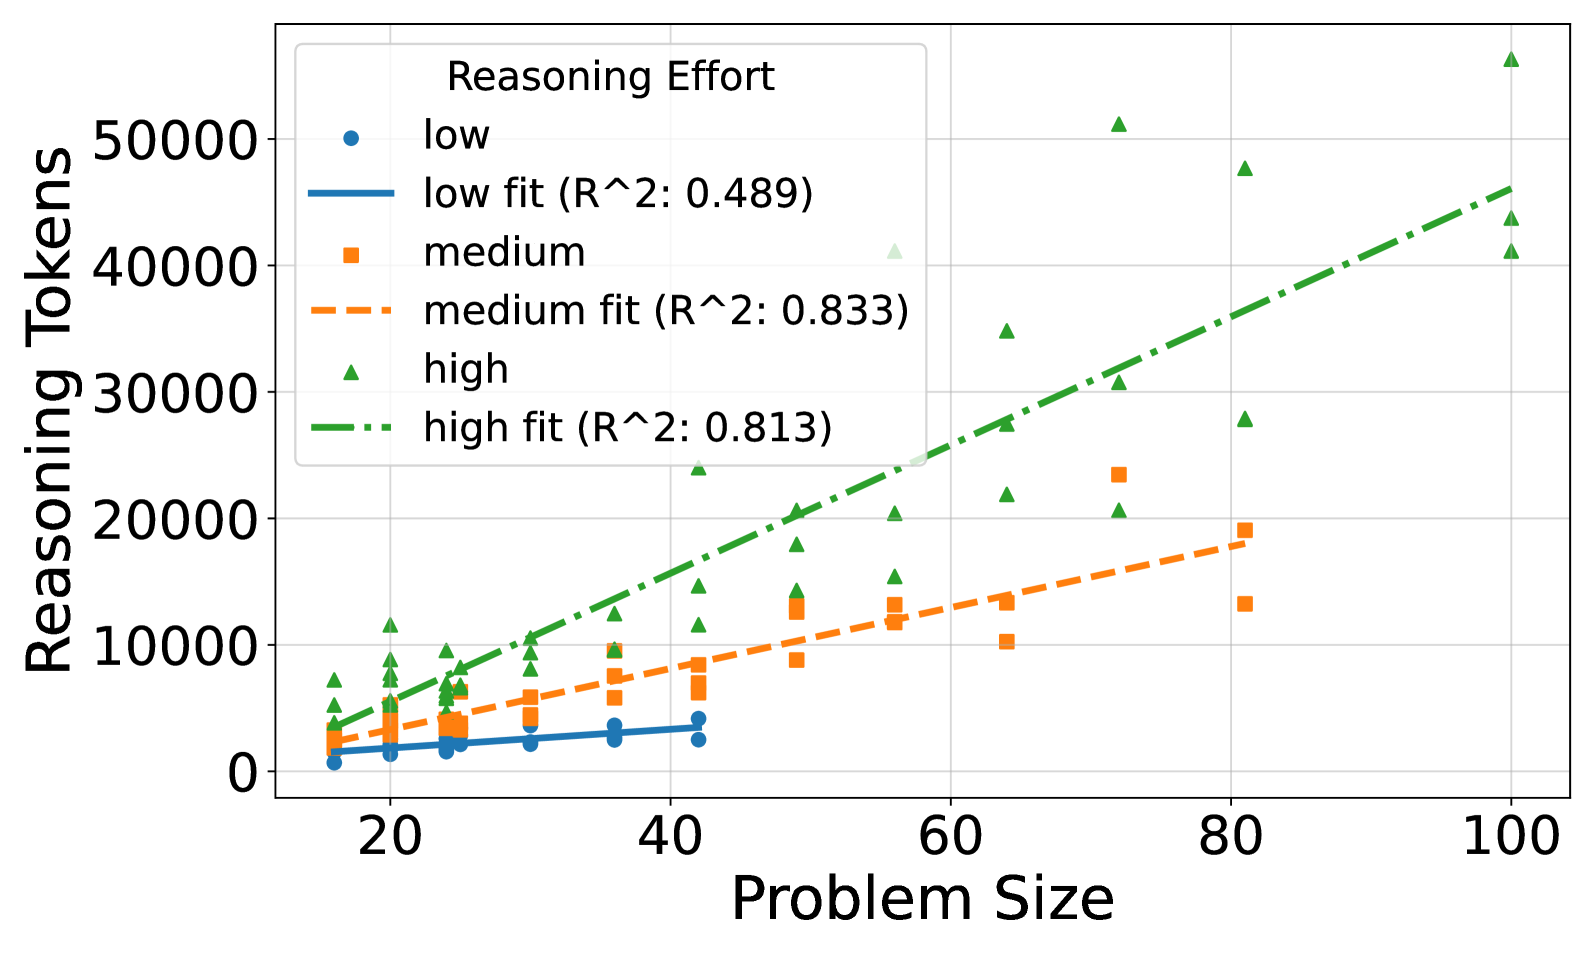
This image presents a scatter plot illustrating the relationship between "Problem Size" (on the x-axis) and "Reasoning Tokens" (on the y-axis) for three different levels of "Reasoning Effort" (low, medium, and high). Each effort level is represented by a different color and a corresponding trendline. The plot aims to demonstrate how the amount of reasoning required (measured in tokens) scales with the complexity of the problem, categorized by the level of effort involved.
### Components/Axes
* **X-axis:** "Problem Size" - Scale ranges from approximately 15 to 105, with markings at 20, 40, 60, 80, and 100.
* **Y-axis:** "Reasoning Tokens" - Scale ranges from 0 to 55,000, with markings at 0, 10,000, 20,000, 30,000, 40,000, and 50,000.
* **Legend:** Located in the top-right corner.
* "low" - Represented by blue circles.
* "medium" - Represented by orange squares.
* "high" - Represented by green triangles.
* **Trendlines:**
* "low fit (R^2: 0.489)" - Solid blue line.
* "medium fit (R^2: 0.833)" - Dashed orange line.
* "high fit (R^2: 0.813)" - Dashed green line.
* **Data Points:** Scatter points representing individual data instances for each reasoning effort level.
### Detailed Analysis
**Low Reasoning Effort (Blue):**
The blue data points are scattered relatively close to the x-axis, with most values between 0 and 5,000 tokens. The trendline is nearly flat, indicating a minimal increase in reasoning tokens with increasing problem size.
* At Problem Size = 20, Reasoning Tokens ≈ 1,000
* At Problem Size = 40, Reasoning Tokens ≈ 2,000
* At Problem Size = 60, Reasoning Tokens ≈ 3,000
* At Problem Size = 80, Reasoning Tokens ≈ 3,000
* At Problem Size = 100, Reasoning Tokens ≈ 4,000
**Medium Reasoning Effort (Orange):**
The orange data points show a more pronounced upward trend than the low effort level. The trendline is steeper, indicating a more significant increase in reasoning tokens with increasing problem size.
* At Problem Size = 20, Reasoning Tokens ≈ 4,000
* At Problem Size = 40, Reasoning Tokens ≈ 7,000
* At Problem Size = 60, Reasoning Tokens ≈ 12,000
* At Problem Size = 80, Reasoning Tokens ≈ 22,000
* At Problem Size = 100, Reasoning Tokens ≈ 28,000
**High Reasoning Effort (Green):**
The green data points exhibit the strongest upward trend, with values ranging from approximately 5,000 to 50,000 tokens. The trendline is the steepest, indicating a substantial increase in reasoning tokens with increasing problem size.
* At Problem Size = 20, Reasoning Tokens ≈ 7,000
* At Problem Size = 40, Reasoning Tokens ≈ 15,000
* At Problem Size = 60, Reasoning Tokens ≈ 25,000
* At Problem Size = 80, Reasoning Tokens ≈ 40,000
* At Problem Size = 100, Reasoning Tokens ≈ 52,000
The R^2 values indicate the goodness of fit for each trendline: 0.489 for low, 0.833 for medium, and 0.813 for high. Higher R^2 values suggest a stronger linear relationship between problem size and reasoning tokens.
### Key Observations
* The relationship between problem size and reasoning tokens is strongly influenced by the reasoning effort level.
* The "low" effort level shows the weakest correlation (lowest R^2 value) and minimal increase in reasoning tokens with problem size.
* The "medium" and "high" effort levels exhibit strong correlations (high R^2 values) and significant increases in reasoning tokens with problem size.
* The "high" effort level consistently requires the most reasoning tokens for any given problem size.
* There is some scatter in the data points around the trendlines, indicating variability in the reasoning token requirements for individual problems within each effort level.
### Interpretation
The data suggests that the amount of reasoning required to solve a problem increases with both the problem's size and the level of reasoning effort applied. The R^2 values indicate that the relationship is more linear and predictable for medium and high reasoning effort levels. The low effort level shows a weaker relationship, possibly because simpler strategies are employed that are less sensitive to problem size.
The increasing trendlines for medium and high effort levels suggest that as problems become more complex, more sophisticated reasoning processes are needed, leading to a greater demand for reasoning tokens. This could be due to the need for more steps, more complex calculations, or more extensive search through possible solutions.
The scatter around the trendlines indicates that there is inherent variability in the reasoning process. Even for problems of the same size and effort level, the exact number of reasoning tokens required can vary depending on the specific problem instance and the approach taken. This variability highlights the complexity of the reasoning process and the challenges in accurately predicting its resource requirements. The data could be used to estimate the computational resources needed for solving problems of different sizes and complexities, depending on the desired level of reasoning effort.