## Line Chart: Reasoning Tokens vs Problem Size
### Overview
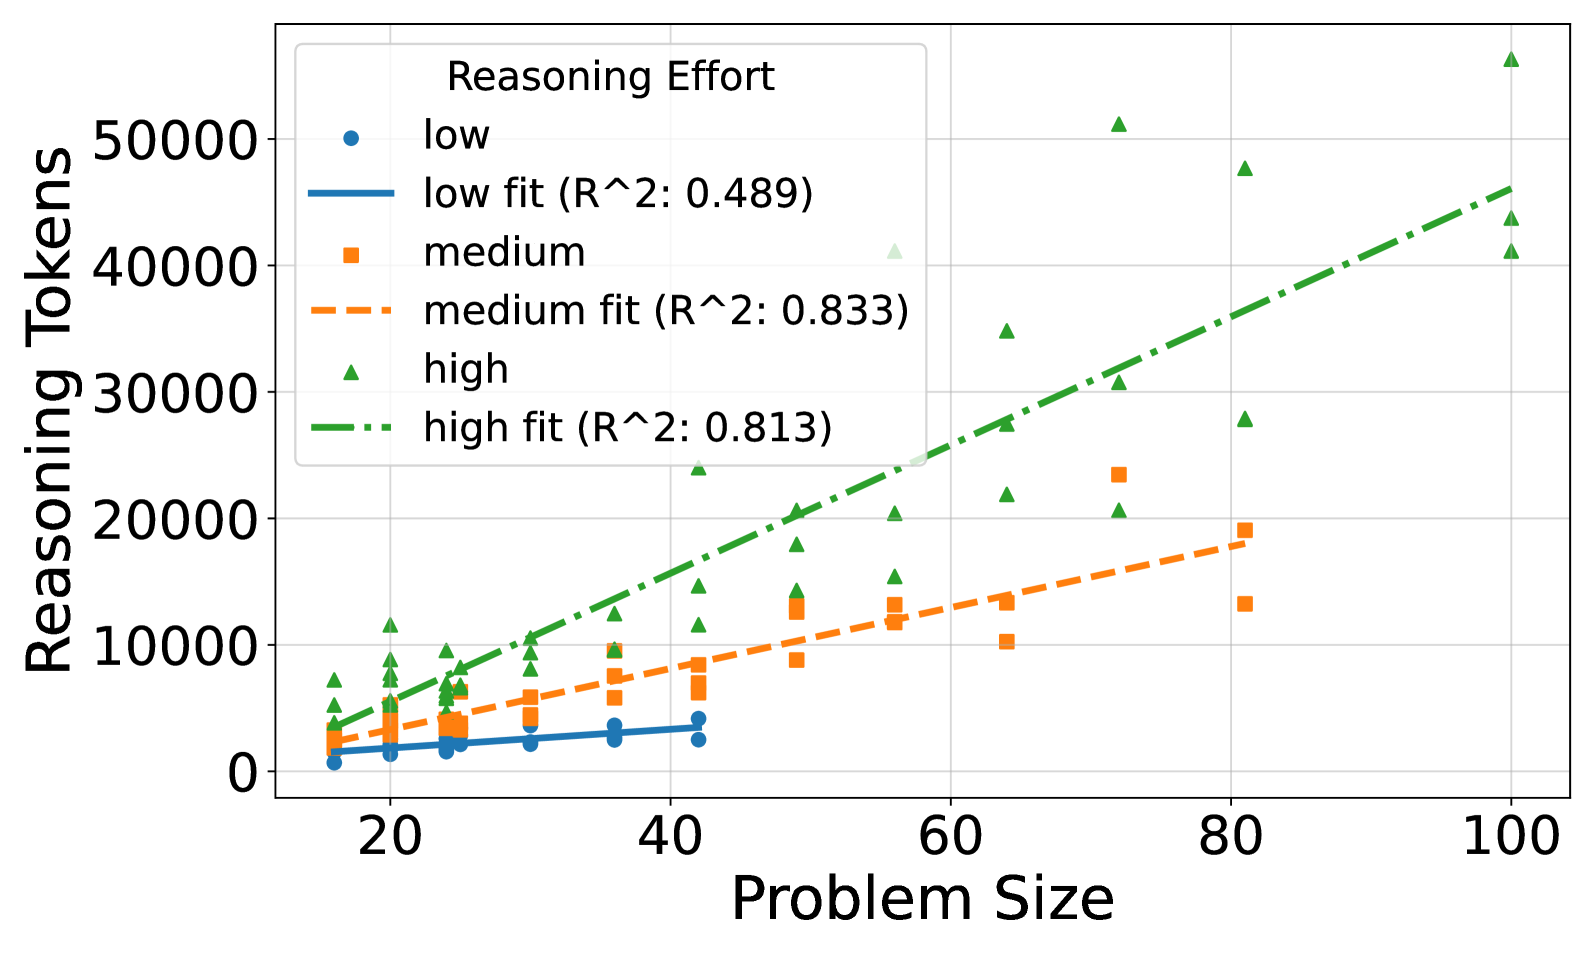
The chart illustrates the relationship between problem size (x-axis) and reasoning tokens consumed (y-axis) across three reasoning effort levels: low, medium, and high. Three data series with distinct markers and trend lines are plotted, each with associated R² values indicating model fit quality.
### Components/Axes
- **X-axis (Problem Size)**: Ranges from 20 to 100 in increments of 20
- **Y-axis (Reasoning Tokens)**: Ranges from 0 to 50,000 in increments of 10,000
- **Legend**: Positioned in top-left corner with three entries:
- Low (blue circles, solid line, R²=0.489)
- Medium (orange squares, dashed line, R²=0.833)
- High (green triangles, dotted line, R²=0.813)
### Detailed Analysis
1. **Low Effort (Blue Circles)**:
- Data points cluster tightly around a shallow upward slope
- Starts near 1,000 tokens at problem size 20
- Reaches ~4,000 tokens at problem size 40
- R²=0.489 indicates moderate linear correlation
2. **Medium Effort (Orange Squares)**:
- Stronger upward trajectory than low effort
- Begins at ~3,000 tokens at problem size 20
- Reaches ~18,000 tokens at problem size 80
- R²=0.833 shows excellent linear fit
3. **High Effort (Green Triangles)**:
- Steepest slope among all series
- Starts at ~5,000 tokens at problem size 20
- Peaks at ~45,000 tokens at problem size 100
- R²=0.813 indicates strong linear relationship
- Notable outliers: 3 data points exceed trend line at problem sizes 60-100
### Key Observations
- All series show positive correlation between problem size and token consumption
- High effort demonstrates 11x greater token usage than low effort at maximum problem size
- Medium effort achieves best predictive accuracy (highest R²)
- High effort series contains 3 outliers above predicted values at larger problem sizes
- Low effort shows weakest linear relationship (lowest R²)
### Interpretation
The data suggests that increased reasoning effort correlates with exponentially higher computational resource requirements. While all effort levels show linear scaling with problem size, the medium effort achieves optimal balance between predictive accuracy (R²=0.833) and resource efficiency. The high effort's outliers at larger problem sizes may indicate edge cases requiring disproportionate resources, potentially highlighting limitations in current reasoning architectures. These findings could inform AI system design by quantifying the trade-off between reasoning depth and computational cost, particularly for large-scale problem solving applications.