## Line Chart: Exact Match (%) vs. SFT Ratio
### Overview
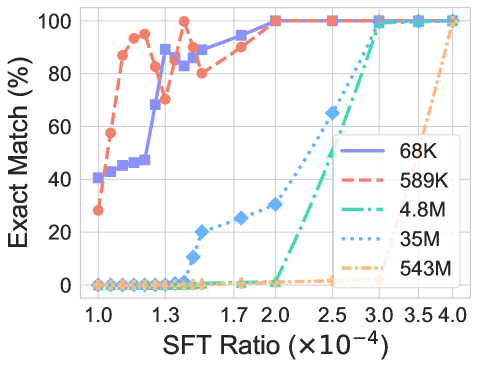
The image is a line chart comparing the "Exact Match (%)" against the "SFT Ratio (×10-4)" for five different data series, labeled as 68K, 589K, 4.8M, 35M, and 543M. The chart illustrates how the exact match percentage changes with the SFT ratio for each series.
### Components/Axes
* **Y-axis (Vertical):** "Exact Match (%)", ranging from 0 to 100, with gridlines at intervals of 20.
* **X-axis (Horizontal):** "SFT Ratio (×10-4)", ranging from 1.0 to 4.0, with gridlines at intervals of approximately 0.5.
* **Legend (Top-Right):**
* Blue solid line: 68K
* Red dashed line: 589K
* Green dash-dotted line: 4.8M
* Light blue dotted line: 35M
* Orange dash-dot-dotted line: 543M
### Detailed Analysis
* **68K (Blue solid line):** Starts at approximately 40% at an SFT Ratio of 1.0, increases to approximately 45% at 1.2, then rises sharply to approximately 85% at 1.3, and reaches 100% at an SFT Ratio of approximately 2.0, remaining at 100% thereafter.
* **589K (Red dashed line):** Begins at approximately 30% at an SFT Ratio of 1.0, increases to approximately 90% at 1.2, peaks at approximately 95% at 1.3, then decreases to approximately 80% at 1.5, before rising again to 100% at an SFT Ratio of approximately 2.0, remaining at 100% thereafter.
* **4.8M (Green dash-dotted line):** Remains at approximately 0% until an SFT Ratio of approximately 2.3, then increases sharply to 100% at an SFT Ratio of approximately 2.7, remaining at 100% thereafter.
* **35M (Light blue dotted line):** Remains at approximately 0% until an SFT Ratio of approximately 1.6, then increases sharply to approximately 65% at an SFT Ratio of approximately 2.3, and reaches 100% at an SFT Ratio of approximately 3.0, remaining at 100% thereafter.
* **543M (Orange dash-dot-dotted line):** Remains at approximately 0% until an SFT Ratio of approximately 3.5, then increases sharply to 100% at an SFT Ratio of approximately 4.0.
### Key Observations
* The 68K and 589K series achieve 100% exact match at lower SFT ratios compared to the 4.8M, 35M, and 543M series.
* The 4.8M, 35M, and 543M series exhibit a sharp transition from 0% to 100% exact match within a narrow range of SFT ratios.
* The 589K series shows a slight dip in exact match percentage before reaching 100%.
### Interpretation
The chart suggests that the "Exact Match (%)" is highly dependent on the "SFT Ratio (×10-4)", and this relationship varies significantly across the different data series (68K, 589K, 4.8M, 35M, and 543M). The lower-valued series (68K and 589K) achieve high exact match percentages at lower SFT ratios, indicating they are more sensitive to changes in this ratio. The higher-valued series (4.8M, 35M, and 543M) require a higher SFT ratio to reach similar levels of exact match, suggesting a different response characteristic. The sharp transitions observed in the 4.8M, 35M, and 543M series could indicate a threshold effect, where a certain SFT ratio is necessary to activate a significant increase in exact match. The dip in the 589K series might be due to some form of over-correction or interference at that specific SFT ratio range.