## Line Chart: Exact Match vs. SFT Ratio
### Overview
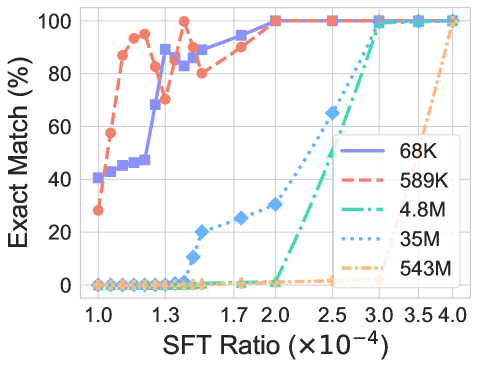
This chart illustrates the relationship between the "SFT Ratio" (Supervised Fine-Tuning Ratio) and the "Exact Match (%)" performance metric across five different model sizes (68K, 589K, 4.8M, 35M, and 543M parameters). The chart demonstrates that smaller models achieve high "Exact Match" performance at significantly lower SFT ratios compared to larger models, which require higher ratios to reach 100% accuracy.
### Components/Axes
* **Y-Axis:** "Exact Match (%)", ranging from 0 to 100 in increments of 20.
* **X-Axis:** "SFT Ratio ($\times 10^{-4}$)", ranging from 1.0 to 4.0.
* **Legend:** Positioned in the middle-right quadrant of the chart. It maps the following model sizes to specific line styles and markers:
* **68K:** Solid purple line with square markers.
* **589K:** Dashed orange-red line with circle markers.
* **4.8M:** Dash-dot teal line with diamond markers.
* **35M:** Dotted blue line with diamond markers.
* **543M:** Dash-dot-dot light orange line with circle markers.
### Detailed Analysis
#### Trend Verification and Data Points
The chart displays a clear trend where smaller models (68K, 589K) show immediate performance gains at low SFT ratios, while larger models (4.8M, 35M, 543M) remain at 0% accuracy until higher SFT ratios are reached.
* **68K (Solid Purple, Square):**
* **Trend:** Starts at ~40% at 1.0. Shows a steady upward trend.
* **Data:** Reaches ~95% at 2.0; hits 100% at 2.5.
* **589K (Dashed Orange-Red, Circle):**
* **Trend:** Starts at ~30% at 1.0. Shows a rapid, steep upward trend.
* **Data:** Reaches ~95% at 1.3; hits 100% at 2.0.
* **4.8M (Dash-dot Teal, Diamond):**
* **Trend:** Remains at 0% until 2.0. Shows a very sharp, near-vertical rise between 2.0 and 3.0.
* **Data:** Hits 100% at 3.0.
* **35M (Dotted Blue, Diamond):**
* **Trend:** Remains at 0% until 1.3. Shows a gradual, stepped increase.
* **Data:** Reaches ~20% at 1.5, ~30% at 2.0, ~65% at 2.5, and hits 100% at 3.0.
* **543M (Dash-dot-dot Light Orange, Circle):**
* **Trend:** Remains at 0% for the entire duration until the very end of the x-axis.
* **Data:** Hits 100% at 4.0.
### Key Observations
* **Inverse Scaling:** There is a strong inverse correlation between model size and the SFT ratio required to achieve 100% Exact Match. The smallest model (589K) reaches 100% at a ratio of 2.0, while the largest model (543M) requires a ratio of 4.0.
* **Performance Thresholds:** The larger models exhibit a "threshold" behavior where they provide zero utility for the specific task until a critical SFT ratio is met, after which performance improves rapidly.
* **Outlier:** The 68K model starts at a higher baseline (40%) than the 589K model (30%) at the 1.0 ratio, suggesting that for very low ratios, the smallest model might be more robust or better aligned than the slightly larger 589K model.
### Interpretation
This data suggests a "phase transition" in model learning behavior during supervised fine-tuning. The larger models appear to require a higher density of training signal (SFT ratio) to "unlock" the ability to produce exact matches. This could imply that larger models are more complex and require more data to align with the specific constraints of the task, whereas smaller models may be more easily overfitted or aligned to specific, rigid output formats. The chart effectively visualizes the trade-off between model capacity and the data requirements for task-specific alignment.