# Technical Document Extraction: Router Weight and Capacity Visualization
This document describes a technical visualization consisting of two primary components: a routing heatmap (left) and a router weight distribution histogram (right).
## 1. Legend and Global Labels
* **Legend (Top Center):**
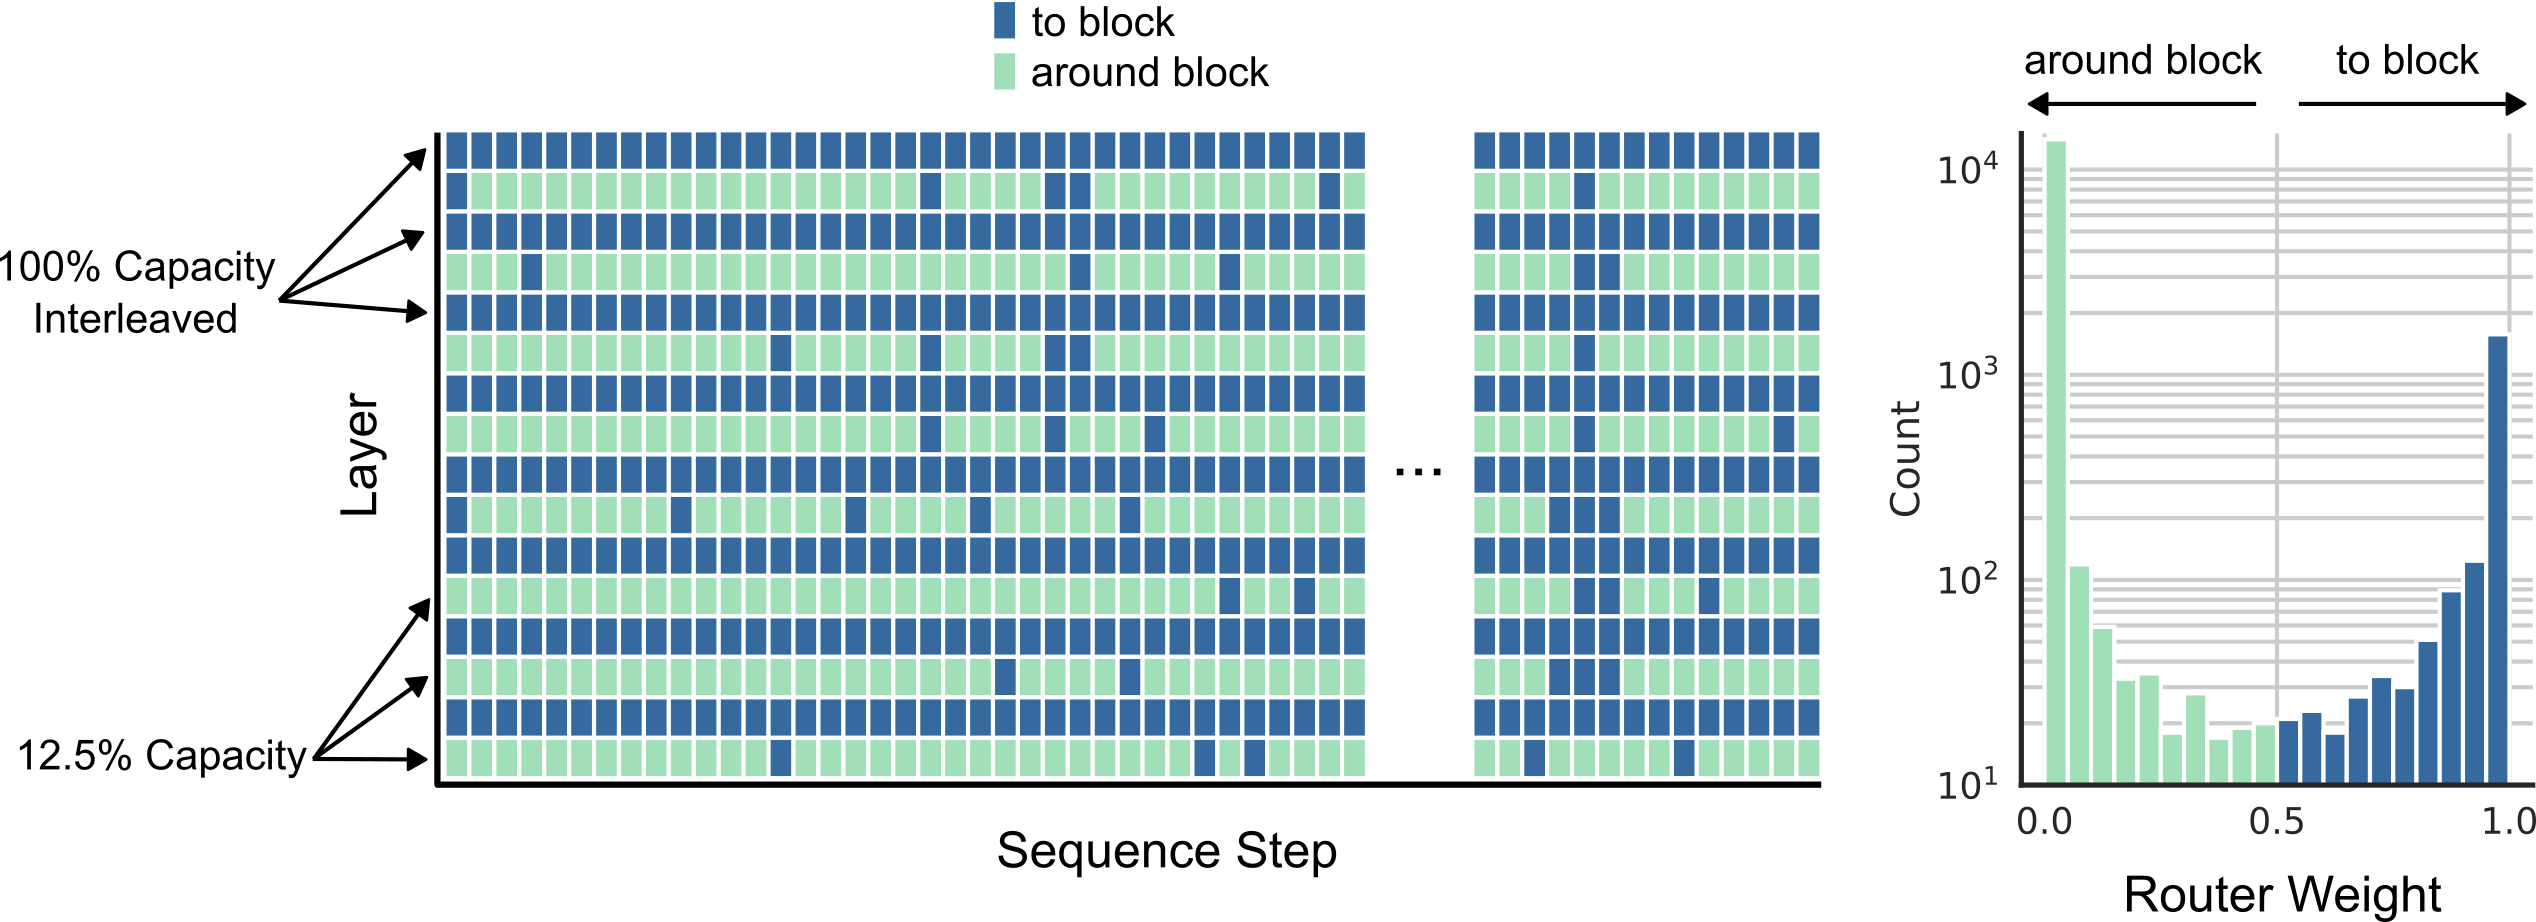
* **Dark Blue Square:** "to block"
* **Light Green Square:** "around block"
* **X-Axis (Main Chart):** "Sequence Step"
* **Y-Axis (Main Chart):** "Layer"
---
## 2. Main Heatmap Analysis (Left)
The heatmap visualizes routing decisions across different layers and sequence steps.
### Component Isolation: Y-Axis Categories
The Y-axis represents different layers of a model, categorized by their capacity settings:
* **100% Capacity Interleaved:** Indicated by arrows pointing to the top three rows. These rows show a high density of "to block" (dark blue) decisions.
* **12.5% Capacity:** Indicated by arrows pointing to the bottom three rows. These rows show a high density of "around block" (light green) decisions.
### Spatial Data Trends
* **Top Layers (100% Capacity):** Predominantly dark blue ("to block"). There are occasional light green cells ("around block") interspersed, but the majority of the sequence steps are routed to the block.
* **Middle Layers:** Show a more balanced or stochastic interleaving of "to block" and "around block" decisions.
* **Bottom Layers (12.5% Capacity):** Predominantly light green ("around block"). Only a few sparse dark blue cells ("to block") appear in these rows, reflecting the lower capacity constraint.
* **Horizontal Continuity:** The chart is split by an ellipsis (**...**), indicating a continuation of the sequence steps.
---
## 3. Router Weight Distribution (Right)
This is a histogram showing the frequency of specific router weights.
### Axis and Labels
* **X-Axis:** "Router Weight" (Scale: 0.0 to 1.0)
* **Y-Axis:** "Count" (Logarithmic scale: $10^1$, $10^2$, $10^3$, $10^4$)
* **Top Annotations:**
* **around block:** Accompanied by a left-pointing arrow covering the range approximately [0.0 to 0.5].
* **to block:** Accompanied by a right-pointing arrow covering the range approximately [0.5 to 1.0].
### Data Trends and Key Points
The histogram is bimodal, with extreme concentrations at the boundaries:
* **"around block" (Light Green Bars):**
* **Peak:** There is a massive peak at $0.0$ router weight, with a count exceeding $10^4$.
* **Trend:** The count drops sharply as the weight increases from $0.0$ to $0.5$, reaching a local minimum around $10^1$.
* **"to block" (Dark Blue Bars):**
* **Trend:** Starting from $0.5$, the count gradually increases as the router weight approaches $1.0$.
* **Peak:** There is a secondary peak at $1.0$ router weight, with a count between $10^3$ and $2 \times 10^3$.
### Summary of Distribution
The router exhibits "hard" routing behavior, where the vast majority of weights are pushed toward the absolute minimum (0.0) or absolute maximum (1.0), corresponding to the binary decision of going "around" or "to" a block.