# Technical Document Extraction: Grid and Bar Chart Analysis
## Left Grid Component
### Structure
- **Axes**:
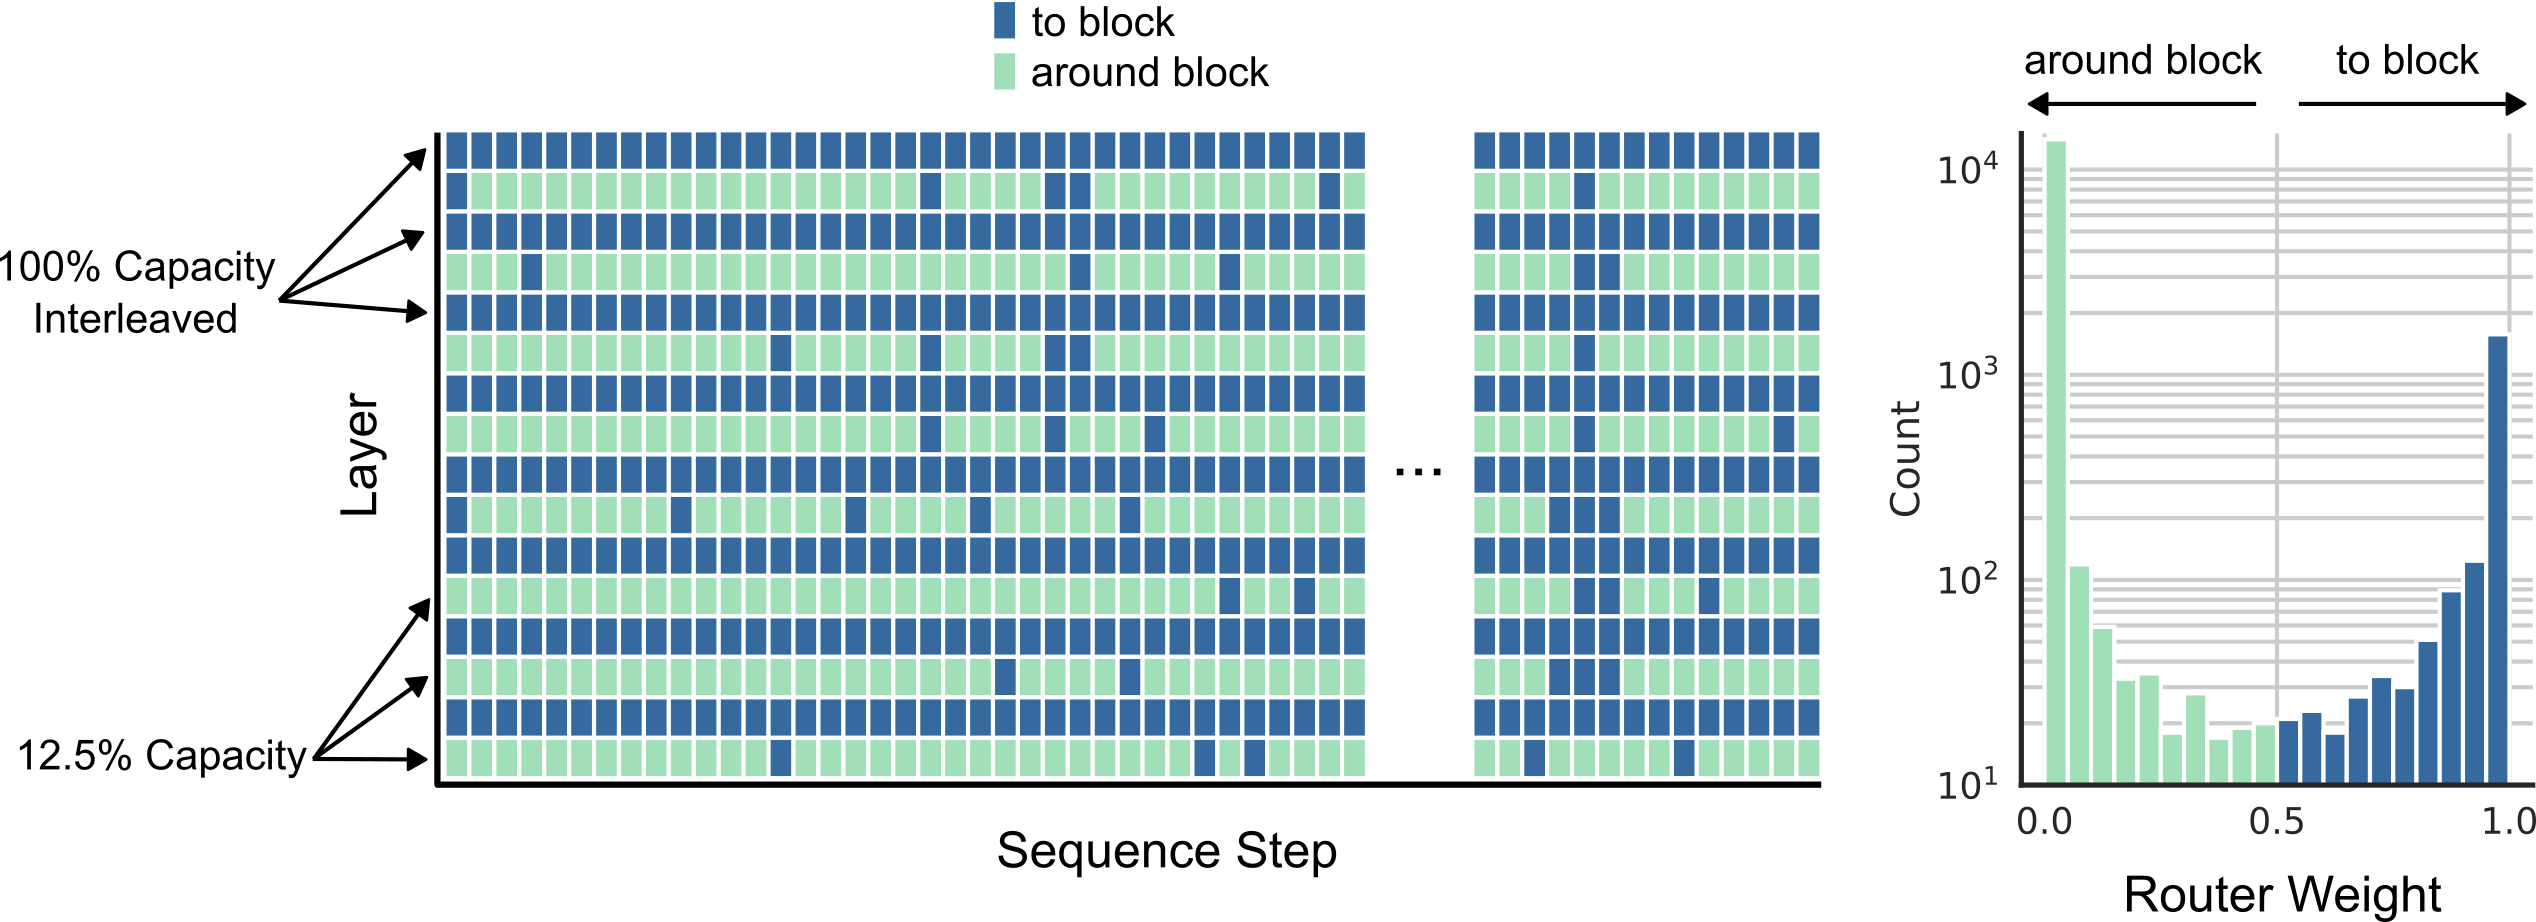
- **X-axis**: `Sequence Step` (horizontal progression)
- **Y-axis**: `Layer` (vertical stacking)
- **Legend**:
- `blue`: "to block"
- `green`: "around block"
### Key Observations
1. **Capacity Indicators**:
- **Top Arrow**: `100% Capacity Interleaved` (points to upper grid section)
- **Bottom Arrow**: `12.5% Capacity` (points to lower grid section)
2. **Pattern**:
- Alternating blue/green squares across sequence steps
- Vertical layering with distinct blue/green distributions
3. **Interleaving**:
- Blue squares (to block) appear in clusters at specific layers
- Green squares (around block) dominate remaining spaces
## Right Bar Chart Component
### Axes
- **X-axis**: `Router Weight` (0.0 to 1.0)
- **Y-axis**: `Count` (logarithmic scale: 10¹ to 10⁴)
### Data Trends
1. **Color Distribution**:
- **Green Bars** ("around block"):
- Concentrated in lower router weight range (0.0–0.5)
- Peak count: ~10³ at 0.0 router weight
- **Blue Bars** ("to block"):
- Dominant in higher router weight range (0.5–1.0)
- Peak count: 10⁴ at 1.0 router weight
### Notable Features
- **Logarithmic Scale**: Y-axis emphasizes exponential differences in counts
- **Transition Zone**: Router weight ~0.5 shows gradual shift from green to blue dominance
## Cross-Referenced Insights
1. **Grid-Bar Correlation**:
- Higher router weights (blue "to block") in the bar chart align with dense blue clusters in the grid's upper layers
- Lower router weights (green "around block") correspond to grid's lower layers with sparse blue squares
2. **Capacity Implications**:
- 100% capacity interleaving suggests maximum utilization of "to block" operations at sequence step boundaries
- 12.5% capacity indicates residual "around block" operations in lower utilization states
## Summary
The grid visualizes operational capacity distribution across sequence steps and layers, while the bar chart quantifies router weight distribution for blocking operations. Both components reveal a clear inverse relationship between router weight and "around block" operations, with "to block" operations dominating at higher utilization thresholds.