## Network Diagram: Mathematical Fields and Their Relationships
### Overview
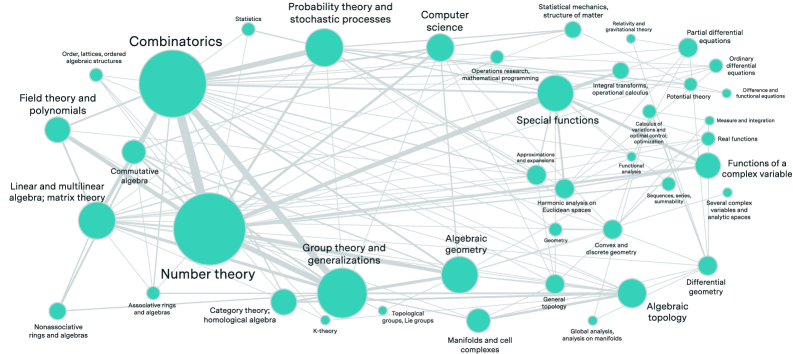
The image is a network diagram illustrating the relationships between various fields of mathematics. The nodes represent mathematical areas, and the edges (lines) connecting them indicate connections or dependencies between these fields. The size of each node appears to correspond to the relative importance or centrality of that field within the network.
### Components/Axes
* **Nodes:** Represented by teal circles, each labeled with a mathematical field or subfield. The size of the circle varies, suggesting a weighting or importance factor.
* **Edges:** Represented by gray lines, connecting the nodes. The thickness of the lines may indicate the strength or frequency of the relationship between the connected fields.
* **Labels:** Text labels are associated with each node, identifying the mathematical field.
### Detailed Analysis or ### Content Details
**Node Labels and Associated Subfields:**
* **Combinatorics:** Located in the top-left quadrant. Subfield: "Order, lattices, ordered algebraic structures"
* **Statistics:** Located in the top-center.
* **Probability theory and stochastic processes:** Located in the top-center.
* **Computer science:** Located in the top-center. Subfields: "Operations research, mathematical programming"
* **Special functions:** Located in the top-right quadrant. Subfields: "Integral transforms, operational calculus", "Approximations and expansions", "Harmonic analysis on Euclidean spaces", "Calculus of variations and optimal control, optimization", "Functional analysis", "Sequences, series, summability"
* **Statistical mechanics, structure of matter:** Located in the top-right quadrant.
* **Relativity and gravitational theory:** Located in the top-right quadrant.
* **Partial differential equations:** Located in the top-right quadrant.
* **Ordinary differential equations:** Located in the right quadrant.
* **Difference and functional equations:** Located in the right quadrant.
* **Functions of a complex variable:** Located in the right quadrant. Subfields: "Measure and integration", "Real functions", "Several complex variables and analytic spaces"
* **Field theory and polynomials:** Located in the left quadrant.
* **Linear and multilinear algebra; matrix theory:** Located in the left quadrant.
* **Commutative algebra:** Located in the left quadrant.
* **Number theory:** Located in the bottom-left quadrant. Subfields: "Associative rings and algebras", "Category theory, homological algebra", "Nonassociative rings and algebras"
* **Group theory and generalizations:** Located in the bottom-center. Subfields: "Topological groups, Lie groups", "K-theory"
* **Algebraic geometry:** Located in the bottom-center. Subfields: "Geometry", "Convex and discrete geometry", "General topology", "Global analysis, analysis on manifolds"
* **Manifolds and cell complexes:** Located in the bottom-center.
* **Algebraic topology:** Located in the bottom-right quadrant.
* **Differential geometry:** Located in the right quadrant.
**Node Sizes:**
* The largest nodes appear to be "Number theory", "Special functions", and "Combinatorics".
* "Group theory and generalizations" is also a relatively large node.
* Other nodes are significantly smaller, suggesting a lesser degree of connectivity or importance within the network.
**Edge Connections:**
* "Combinatorics" has connections to "Statistics", "Probability theory and stochastic processes", "Computer science", "Field theory and polynomials", "Linear and multilinear algebra; matrix theory", "Commutative algebra", and "Number theory".
* "Number theory" has connections to "Combinatorics", "Group theory and generalizations", "Algebraic geometry", "Linear and multilinear algebra; matrix theory", and "Commutative algebra".
* "Special functions" has connections to "Computer science", "Statistical mechanics, structure of matter", "Relativity and gravitational theory", "Partial differential equations", "Ordinary differential equations", "Difference and functional equations", "Functions of a complex variable", "Algebraic geometry", and "Algebraic topology".
### Key Observations
* The diagram highlights the interconnectedness of various mathematical fields.
* "Number theory", "Special functions", and "Combinatorics" appear to be central hubs in this network.
* The density of connections varies across the diagram, indicating stronger relationships between some fields than others.
### Interpretation
This network diagram provides a visual representation of the relationships between different areas of mathematics. The size of the nodes and the thickness of the edges suggest the relative importance and strength of these relationships. The diagram could be used to understand the dependencies between different mathematical fields, identify areas of potential cross-disciplinary research, or visualize the structure of mathematical knowledge. The central role of "Number theory", "Special functions", and "Combinatorics" suggests that these fields have broad applications and connections to many other areas of mathematics. The diagram also reveals clusters of related fields, such as the cluster around "Special functions" which includes "Partial differential equations", "Ordinary differential equations", and "Functions of a complex variable". This suggests that these fields share common concepts and techniques.