## Table: AI Model Performance Across Error Categories
### Overview
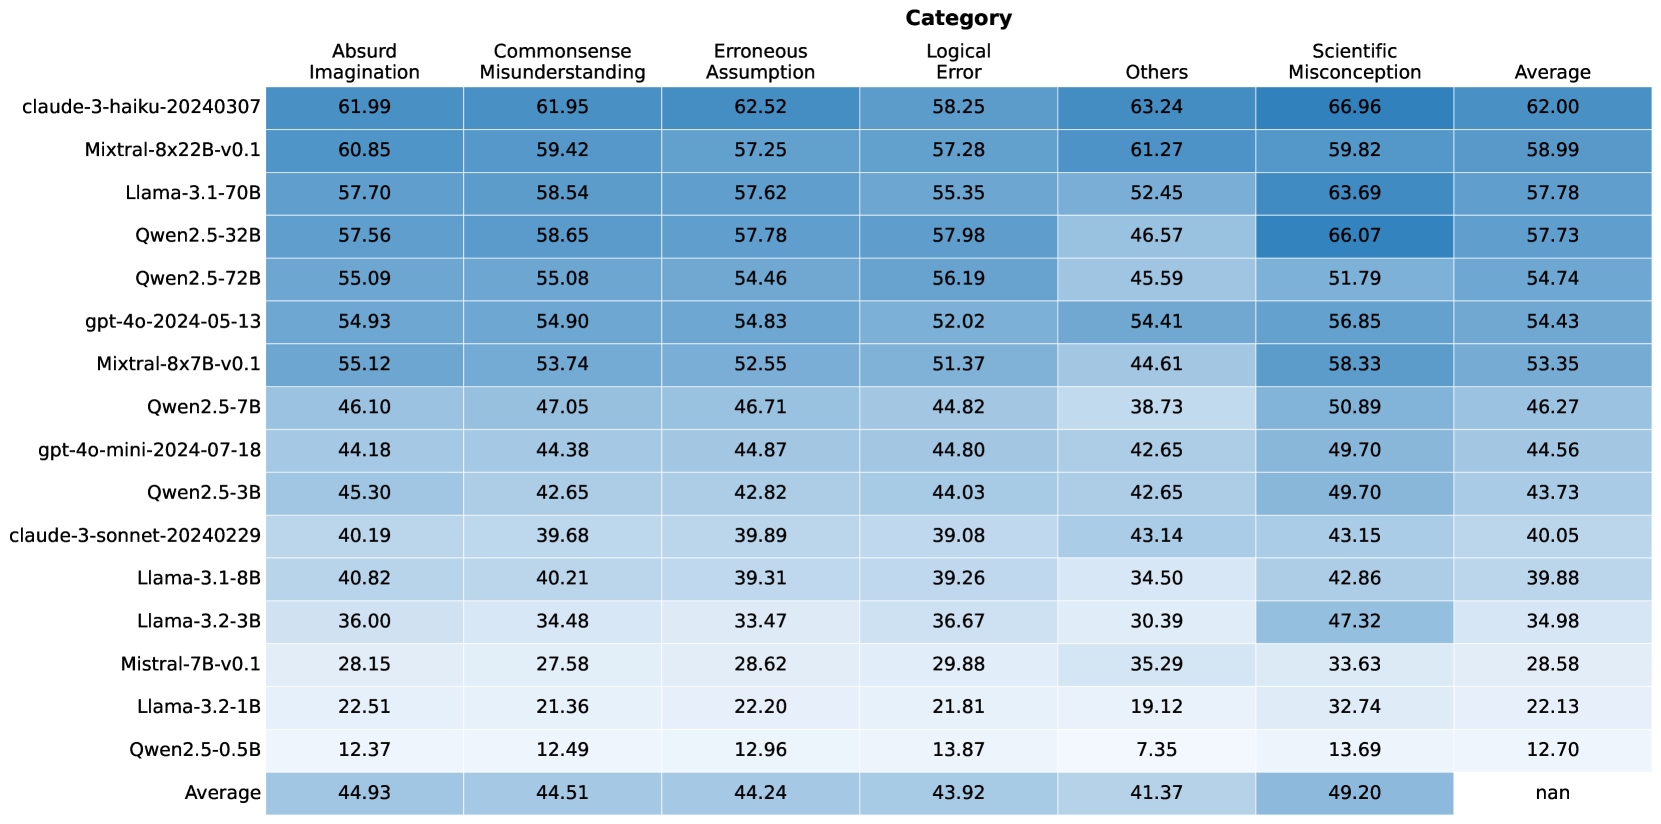
The image displays a heatmap-style table comparing the performance of 16 different large language models (LLMs) across six specific error categories and an overall average. The performance metric is numerical, likely representing a score or accuracy percentage, with higher values indicating better performance. The table uses a blue color gradient, where darker shades correspond to higher scores.
### Components/Axes
* **Rows (Models):** 16 distinct AI models are listed vertically on the left side. They are ordered from highest to lowest average score.
* **Columns (Categories):** 7 columns are present. The first six are specific error categories, and the final column is the "Average" score across all categories for each model.
* **Header Row:** The top row contains the column labels: "Absurd Imagination", "Commonsense Misunderstanding", "Erroneous Assumption", "Logical Error", "Others", "Scientific Misconception", and "Average".
* **Footer Row:** The bottom row is labeled "Average" and provides the average score for each category across all listed models.
* **Data Cells:** Each cell contains a numerical value with two decimal places, representing the model's score in that specific category.
### Detailed Analysis
**Model List (Rows, from top to bottom):**
1. claude-3-haiku-20240307
2. Mixtral-8x22B-v0.1
3. Llama-3.1-70B
4. Qwen2.5-32B
5. Qwen2.5-72B
6. gpt-4o-2024-05-13
7. Mixtral-8x7B-v0.1
8. Qwen2.5-7B
9. gpt-4o-mini-2024-07-18
10. Qwen2.5-3B
11. claude-3-sonnet-20240229
12. Llama-3.1-8B
13. Llama-3.2-3B
14. Mistral-7B-v0.1
15. Llama-3.2-1B
16. Qwen2.5-0.5B
**Category List (Columns, from left to right):**
1. Absurd Imagination
2. Commonsense Misunderstanding
3. Erroneous Assumption
4. Logical Error
5. Others
6. Scientific Misconception
7. Average
**Complete Data Table (Model x Category Scores):**
| Model | Absurd Imagination | Commonsense Misunderstanding | Erroneous Assumption | Logical Error | Others | Scientific Misconception | Average |
| :--- | :--- | :--- | :--- | :--- | :--- | :--- | :--- |
| **claude-3-haiku-20240307** | 61.99 | 61.95 | 62.52 | 58.25 | 63.24 | 66.96 | 62.00 |
| **Mixtral-8x22B-v0.1** | 60.85 | 59.42 | 57.25 | 57.28 | 61.27 | 59.82 | 58.99 |
| **Llama-3.1-70B** | 57.70 | 58.54 | 57.62 | 55.35 | 52.45 | 63.69 | 57.78 |
| **Qwen2.5-32B** | 57.56 | 58.65 | 57.78 | 57.98 | 46.57 | 66.07 | 57.73 |
| **Qwen2.5-72B** | 55.09 | 55.08 | 54.46 | 56.19 | 45.59 | 51.79 | 54.74 |
| **gpt-4o-2024-05-13** | 54.93 | 54.90 | 54.83 | 52.02 | 54.41 | 56.85 | 54.43 |
| **Mixtral-8x7B-v0.1** | 55.12 | 53.74 | 52.55 | 51.37 | 44.61 | 58.33 | 53.35 |
| **Qwen2.5-7B** | 46.10 | 47.05 | 46.71 | 44.82 | 38.73 | 50.89 | 46.27 |
| **gpt-4o-mini-2024-07-18** | 44.18 | 44.38 | 44.87 | 44.80 | 42.65 | 49.70 | 44.56 |
| **Qwen2.5-3B** | 45.30 | 42.65 | 42.82 | 44.03 | 42.65 | 49.70 | 43.73 |
| **claude-3-sonnet-20240229** | 40.19 | 39.68 | 39.89 | 39.08 | 43.14 | 43.15 | 40.05 |
| **Llama-3.1-8B** | 40.82 | 40.21 | 39.31 | 39.26 | 34.50 | 42.86 | 39.88 |
| **Llama-3.2-3B** | 36.00 | 34.48 | 33.47 | 36.67 | 30.39 | 47.32 | 34.98 |
| **Mistral-7B-v0.1** | 28.15 | 27.58 | 28.62 | 29.88 | 35.29 | 33.63 | 28.58 |
| **Llama-3.2-1B** | 22.51 | 21.36 | 22.20 | 21.81 | 19.12 | 32.74 | 22.13 |
| **Qwen2.5-0.5B** | 12.37 | 12.49 | 12.96 | 13.87 | 7.35 | 13.69 | 12.70 |
| **Average** | **44.93** | **44.51** | **44.24** | **43.92** | **41.37** | **49.20** | **nan** |
### Key Observations
1. **Performance Hierarchy:** There is a clear and significant performance gradient. The top model (`claude-3-haiku-20240307`, avg 62.00) scores nearly five times higher than the bottom model (`Qwen2.5-0.5B`, avg 12.70).
2. **Category Difficulty:** The "Scientific Misconception" category has the highest average score (49.20), suggesting models find this category relatively easier. The "Others" category has the lowest average (41.37), indicating it may be the most challenging or heterogeneous.
3. **Model Consistency:** The top-performing model (`claude-3-haiku-20240307`) shows strong, consistent performance across all categories, with no score below 58.25.
4. **Notable Outliers:**
* `Qwen2.5-32B` achieves the second-highest single-category score (66.07 in Scientific Misconception) but has a relatively low score in "Others" (46.57).
* `Llama-3.2-3B` shows a significant disparity, scoring poorly in most categories but achieving a relatively high 47.32 in "Scientific Misconception".
* The "Others" category shows the widest variance among models, with scores ranging from 7.35 to 63.24.
5. **Model Family Trends:** Within the Qwen2.5 series, performance scales predictably with model size (0.5B < 3B < 7B < 32B < 72B), though the 72B model underperforms the 32B model in the overall average.
### Interpretation
This table provides a comparative benchmark of LLMs on their ability to avoid or correctly handle specific types of reasoning errors. The data suggests that model scale (parameter count) is a strong, but not absolute, predictor of performance, as seen in the Qwen2.5 family. However, architecture and training data also play critical roles, evidenced by `claude-3-haiku-20240307` outperforming larger models like `Mixtral-8x22B-v0.1` and `Qwen2.5-72B`.
The categorization of errors implies a focus on testing robustness and reasoning rather than just factual recall. The high average in "Scientific Misconception" might indicate that models are better trained on scientific facts or that the test set for this category is less ambiguous. Conversely, the low average and high variance in "Others" suggest this is a catch-all for complex, nuanced, or rare error types that current models struggle with consistently.
For a technical user, this table is a tool for model selection based on specific use-case vulnerabilities. For instance, if an application is prone to logical errors, one might prioritize `Qwen2.5-32B` (57.98) over `Llama-3.1-70B` (55.35), despite the latter's larger size. The "nan" in the bottom-right cell indicates the overall average of the averages was not calculated or is not meaningful in this context.