\n
## Line Chart: Execution Time vs. Input Length
### Overview
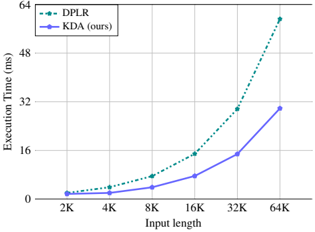
This image presents a line chart comparing the execution time of two methods, DPLR and KDA (labeled as "ours"), across varying input lengths. The chart visually demonstrates how execution time scales with input length for each method.
### Components/Axes
* **X-axis:** "Input length" with markers at 2K, 4K, 8K, 16K, 32K, and 64K.
* **Y-axis:** "Execution Time (ms)" with a scale ranging from 0 to 64 ms, marked at intervals of 8 ms.
* **Legend:** Located in the top-left corner, it identifies the two data series:
* DPLR (represented by a dashed light-blue line with a diamond marker)
* KDA (ours) (represented by a solid dark-blue line with a circle marker)
* **Gridlines:** Faint vertical gridlines are present to aid in reading values.
### Detailed Analysis
**DPLR (dashed light-blue line):**
The DPLR line slopes upward, indicating increasing execution time with increasing input length.
* At 2K input length: Approximately 1.5 ms.
* At 4K input length: Approximately 3 ms.
* At 8K input length: Approximately 6 ms.
* At 16K input length: Approximately 14 ms.
* At 32K input length: Approximately 30 ms.
* At 64K input length: Approximately 57 ms.
**KDA (solid dark-blue line):**
The KDA line also slopes upward, but at a slower rate than the DPLR line, especially at larger input lengths.
* At 2K input length: Approximately 1 ms.
* At 4K input length: Approximately 2 ms.
* At 8K input length: Approximately 4 ms.
* At 16K input length: Approximately 8 ms.
* At 32K input length: Approximately 16 ms.
* At 64K input length: Approximately 31 ms.
### Key Observations
* KDA consistently exhibits lower execution times than DPLR across all input lengths.
* The difference in execution time between the two methods becomes more pronounced as the input length increases. The gap widens significantly at 32K and 64K.
* Both methods demonstrate a non-linear relationship between input length and execution time; the execution time increases at an accelerating rate as the input length grows.
### Interpretation
The data suggests that KDA ("ours") is more scalable and efficient than DPLR, particularly when dealing with larger input lengths. The increasing slope of both lines indicates that the computational complexity of both algorithms is likely greater than linear with respect to input size. The widening gap between the two lines implies that the scaling difference between the algorithms becomes more significant as the problem size increases. This could be due to differences in algorithmic complexity, optimization techniques, or implementation details. The chart effectively demonstrates the performance advantage of KDA over DPLR, especially in scenarios involving substantial input data.