## Line Chart: Execution Time vs. Input Length for DPLR and KDA Methods
### Overview
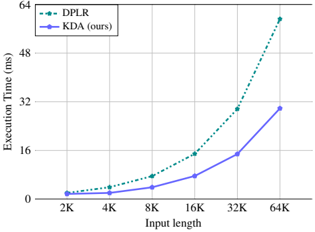
The image is a line chart comparing the computational performance (execution time) of two methods, labeled "DPLR" and "KDA (ours)", as a function of increasing input length. The chart demonstrates that the KDA method consistently requires less execution time than the DPLR method across all tested input lengths, with the performance gap widening significantly as the input length grows.
### Components/Axes
* **Chart Type:** 2D line chart with markers.
* **X-Axis (Horizontal):**
* **Label:** "Input length"
* **Scale:** Logarithmic (base 2), with major tick marks at 2K, 4K, 8K, 16K, 32K, and 64K.
* **Y-Axis (Vertical):**
* **Label:** "Execution Time (ms)"
* **Scale:** Linear, with major tick marks at 0, 16, 32, 48, and 64 milliseconds.
* **Legend:** Positioned in the top-left corner of the chart area.
* **DPLR:** Represented by a green, dashed line with diamond-shaped markers.
* **KDA (ours):** Represented by a blue, solid line with circular markers.
### Detailed Analysis
**Data Series: DPLR (Green, Dashed Line with Diamonds)**
* **Trend:** The line exhibits a steep, upward-curving (super-linear or exponential) trend. Execution time increases rapidly with input length.
* **Approximate Data Points:**
* Input 2K: ~2 ms
* Input 4K: ~4 ms
* Input 8K: ~8 ms
* Input 16K: ~15 ms
* Input 32K: ~30 ms
* Input 64K: ~60 ms
**Data Series: KDA (ours) (Blue, Solid Line with Circles)**
* **Trend:** The line shows a more gradual, upward-sloping trend that appears closer to linear. Execution time increases with input length but at a much slower rate than DPLR.
* **Approximate Data Points:**
* Input 2K: ~1 ms
* Input 4K: ~2 ms
* Input 8K: ~4 ms
* Input 16K: ~8 ms
* Input 32K: ~15 ms
* Input 64K: ~30 ms
### Key Observations
1. **Performance Crossover:** There is no crossover point; KDA is faster than DPLR at every measured input length.
2. **Diverging Gap:** The absolute difference in execution time between the two methods grows substantially as input length increases. At 2K, the difference is ~1 ms. At 64K, the difference is ~30 ms.
3. **Relative Scaling:** The KDA method at 64K input length (~30 ms) performs comparably to the DPLR method at 32K input length (~30 ms), suggesting KDA can handle double the input size for the same time cost at this scale.
4. **Visual Confirmation:** The green dashed line (DPLR) is consistently positioned above the blue solid line (KDA) across the entire chart, confirming the performance advantage.
### Interpretation
The chart provides strong empirical evidence that the proposed "KDA" method is more computationally efficient than the "DPLR" method for the task being measured. The key takeaway is not just that KDA is faster, but that its **scaling behavior is superior**. The near-linear growth of KDA's execution time versus the super-linear growth of DPLR's indicates that KDA will become increasingly advantageous for larger-scale problems. This suggests the underlying algorithm or implementation of KDA handles increased data volume more effectively, making it a more scalable solution. The label "(ours)" implies this chart is likely from a research paper or technical report where the authors are presenting KDA as their novel contribution, and this figure serves as a primary result demonstrating its performance benefit.