## Line Chart: Loss Value vs. Epoch for Different Tasks
### Overview
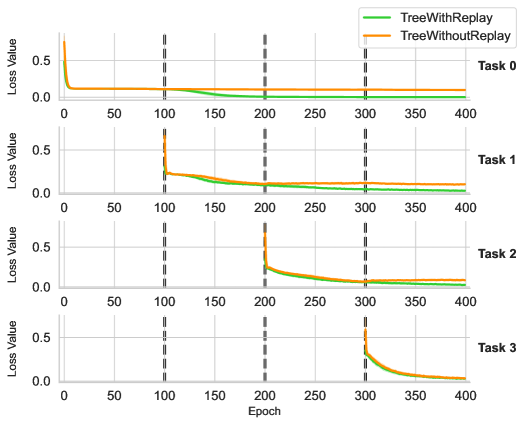
The image presents a series of four line charts, each displaying the loss value over epochs for two different training methods: "TreeWithReplay" and "TreeWithoutReplay." Each chart corresponds to a different task (Task 0, Task 1, Task 2, and Task 3). The x-axis represents the epoch number, ranging from 0 to 400. The y-axis represents the loss value, ranging from 0.0 to 0.5. Vertical dashed lines are present at Epoch 100, 200, and 300.
### Components/Axes
* **Title:** Loss Value vs. Epoch for Different Tasks (inferred)
* **Y-axis Label:** Loss Value
* **X-axis Label:** Epoch
* **X-axis Scale:** 0, 50, 100, 150, 200, 250, 300, 350, 400
* **Y-axis Scale:** 0.0, 0.5
* **Legend (Top-Right):**
* Green Line: TreeWithReplay
* Orange Line: TreeWithoutReplay
* **Tasks:** Task 0, Task 1, Task 2, Task 3
* **Vertical Dashed Lines:** Epoch 100, Epoch 200, Epoch 300
### Detailed Analysis
**Task 0:**
* **TreeWithReplay (Green):** Starts at approximately 0.5 and rapidly decreases to approximately 0.05 by epoch 50, then remains relatively constant.
* **TreeWithoutReplay (Orange):** Starts at approximately 0.1 and remains relatively constant throughout the epochs.
**Task 1:**
* **TreeWithReplay (Green):** Starts at approximately 0.5, rapidly decreases to approximately 0.1 by epoch 100, then decreases further to approximately 0.05 by epoch 200, and remains relatively constant.
* **TreeWithoutReplay (Orange):** Starts at approximately 0.6, rapidly decreases to approximately 0.2 by epoch 100, then decreases further to approximately 0.1 by epoch 200, and remains relatively constant.
**Task 2:**
* **TreeWithReplay (Green):** Starts at approximately 0.5, rapidly decreases to approximately 0.1 by epoch 200, then decreases further to approximately 0.05 by epoch 300, and remains relatively constant.
* **TreeWithoutReplay (Orange):** Starts at approximately 0.6, rapidly decreases to approximately 0.2 by epoch 200, then decreases further to approximately 0.1 by epoch 300, and remains relatively constant.
**Task 3:**
* **TreeWithReplay (Green):** Starts at approximately 0.5, rapidly decreases to approximately 0.1 by epoch 300, then decreases further to approximately 0.05 by epoch 400.
* **TreeWithoutReplay (Orange):** Starts at approximately 0.6, rapidly decreases to approximately 0.2 by epoch 300, then decreases further to approximately 0.1 by epoch 400.
### Key Observations
* The loss value generally decreases as the epoch number increases for both methods across all tasks.
* The "TreeWithReplay" method generally achieves a lower loss value than the "TreeWithoutReplay" method, especially in later tasks.
* The rate of decrease in loss value slows down as the epoch number increases.
* The vertical dashed lines at Epoch 100, 200, and 300 seem to indicate significant points in the training process, possibly marking the end of a training phase or the introduction of a new task.
* The initial loss values for both methods are higher in later tasks (Task 1, Task 2, Task 3) compared to Task 0.
### Interpretation
The charts demonstrate the learning process of two different training methods ("TreeWithReplay" and "TreeWithoutReplay") across multiple tasks. The decreasing loss values indicate that both methods are learning and improving their performance as the training progresses. The "TreeWithReplay" method appears to be more effective in reducing the loss value, suggesting that the replay mechanism contributes to better learning. The increasing initial loss values in later tasks may indicate that the model is facing more challenging problems or that the tasks are becoming more complex. The vertical dashed lines could represent milestones in the training process, such as the introduction of new data or changes in the training parameters. The data suggests that "TreeWithReplay" is a superior method for this type of learning task.