## Line Chart: EGA vs Perturbed (required items, action)
### Overview
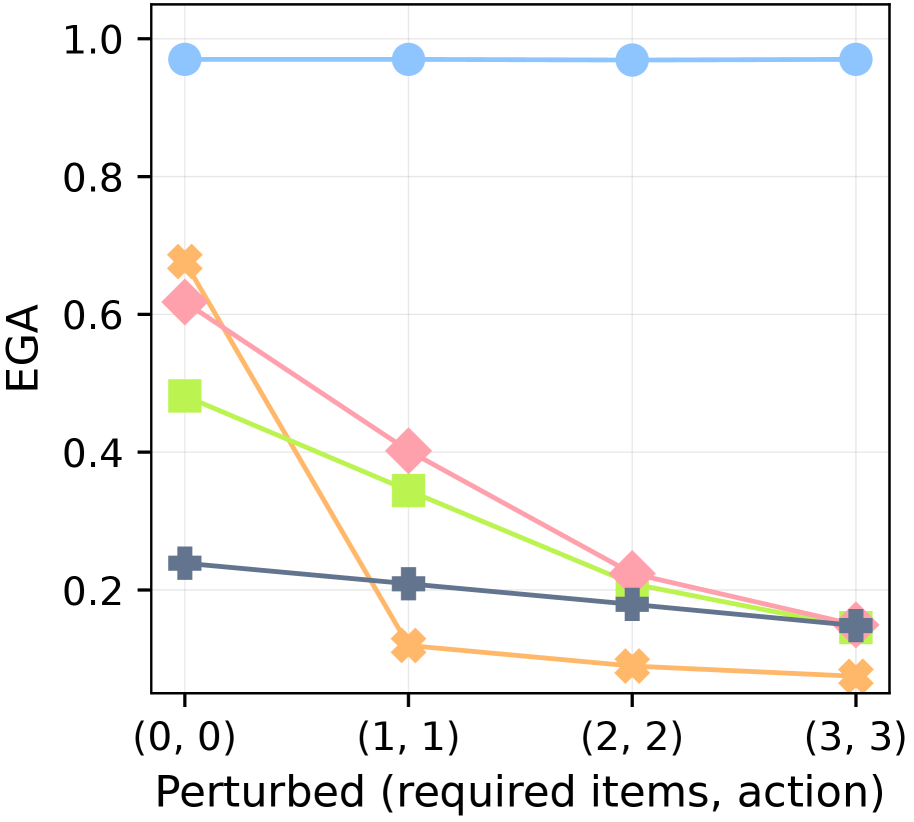
The image is a line chart showing the relationship between EGA (Expected Goal Achievement) and the level of perturbation, represented as "(required items, action)". There are four distinct data series, each represented by a different color and marker. The x-axis represents the perturbation level, increasing from (0, 0) to (3, 3). The y-axis represents the EGA, ranging from 0.0 to 1.0.
### Components/Axes
* **X-axis:** "Perturbed (required items, action)" with markers at (0, 0), (1, 1), (2, 2), and (3, 3).
* **Y-axis:** "EGA" ranging from 0.2 to 1.0 in increments of 0.2.
* **Data Series:** Four distinct lines with different colors and markers. The legend is missing, so the colors are described below.
### Detailed Analysis
* **Light Blue (Circles):** This line remains constant at approximately EGA = 0.98 across all perturbation levels.
* (0, 0): 0.98
* (1, 1): 0.98
* (2, 2): 0.98
* (3, 3): 0.98
* **Orange (X):** This line shows a decreasing trend as the perturbation level increases.
* (0, 0): 0.68
* (1, 1): 0.12
* (2, 2): 0.08
* (3, 3): 0.07
* **Pink (Diamonds):** This line also shows a decreasing trend as the perturbation level increases.
* (0, 0): 0.62
* (1, 1): 0.40
* (2, 2): 0.22
* (3, 3): 0.15
* **Lime Green (Squares):** This line shows a decreasing trend as the perturbation level increases.
* (0, 0): 0.48
* (1, 1): 0.35
* (2, 2): 0.20
* (3, 3): 0.15
* **Dark Grey (Plus Signs):** This line shows a slight decreasing trend as the perturbation level increases.
* (0, 0): 0.24
* (1, 1): 0.21
* (2, 2): 0.18
* (3, 3): 0.14
### Key Observations
* The light blue line representing one of the strategies maintains a high EGA regardless of the perturbation level.
* The orange, pink, and lime green lines show a significant decrease in EGA as the perturbation level increases.
* The dark grey line shows a slight decrease in EGA as the perturbation level increases.
### Interpretation
The chart suggests that some strategies (represented by the light blue line) are robust to perturbations, maintaining a high expected goal achievement even when the required items or actions are altered. Other strategies (represented by the orange, pink, and lime green lines) are highly sensitive to perturbations, with their EGA decreasing significantly as the perturbation level increases. The dark grey line represents a strategy that is somewhat sensitive to perturbations, but not as much as the orange, pink, and lime green lines. The data demonstrates the varying degrees of robustness of different strategies to changes in the environment or task requirements.