## Line Graph: EGA Performance Across Perturbations
### Overview
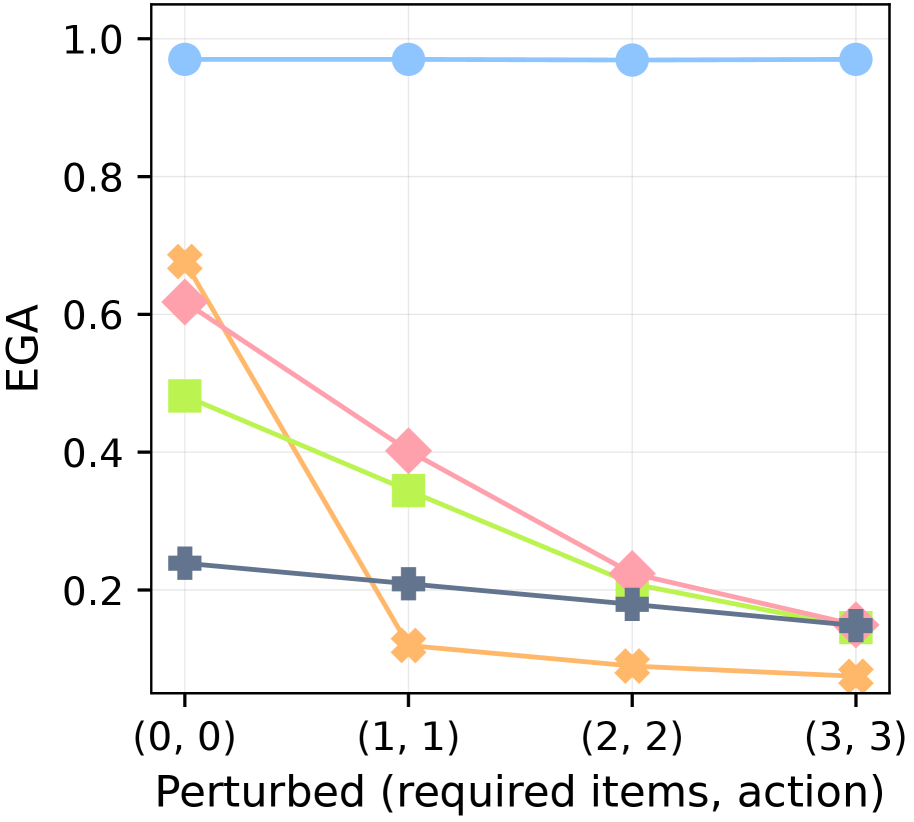
The image depicts a line graph comparing the performance of four data series (labeled in the legend) across four perturbation points: (0,0), (1,1), (2,2), and (3,3). The y-axis measures "EGA" (Effective Goal Achievement) on a scale from 0.0 to 1.0, while the x-axis represents perturbation magnitude as a tuple of "required items" and "action" values. All lines show distinct trends, with one remaining constant and others declining sharply.
---
### Components/Axes
- **X-Axis**: Labeled "Perturbed (required items, action)" with discrete points at (0,0), (1,1), (2,2), and (3,3).
- **Y-Axis**: Labeled "EGA" with a linear scale from 0.0 to 1.0.
- **Legend**: Located on the right, associating:
- Blue circles → "Series A"
- Pink diamonds → "Series B"
- Green squares → "Series C"
- Orange crosses → "Series D"
---
### Detailed Analysis
1. **Series A (Blue Circles)**:
- **Trend**: Flat line at 1.0 across all x-values.
- **Data Points**:
- (0,0): 1.0
- (1,1): 1.0
- (2,2): 1.0
- (3,3): 1.0
2. **Series B (Pink Diamonds)**:
- **Trend**: Steady decline from 0.6 to 0.15.
- **Data Points**:
- (0,0): 0.6
- (1,1): 0.4
- (2,2): 0.25
- (3,3): 0.15
3. **Series C (Green Squares)**:
- **Trend**: Gradual decline from 0.5 to 0.12.
- **Data Points**:
- (0,0): 0.5
- (1,1): 0.35
- (2,2): 0.2
- (3,3): 0.12
4. **Series D (Orange Crosses)**:
- **Trend**: Sharpest decline from 0.7 to 0.05.
- **Data Points**:
- (0,0): 0.7
- (1,1): 0.1
- (2,2): 0.08
- (3,3): 0.05
---
### Key Observations
- **Series A** remains constant at 1.0, suggesting it is unaffected by perturbations.
- **Series D** exhibits the most significant drop, losing 93% of its EGA value from (0,0) to (3,3).
- **Series B** and **C** show intermediate declines, with Series B dropping 75% and Series C dropping 76%.
- All declining series converge near 0.1–0.2 at (3,3), indicating a threshold of minimal EGA under high perturbation.
---
### Interpretation
The graph demonstrates that EGA performance degrades as perturbation magnitude increases, with varying resilience across series. Series A’s stability implies it represents a baseline or control condition (e.g., unperturbed system). Series D’s rapid decline suggests it is highly sensitive to perturbations, possibly modeling a fragile system. The convergence of declining series at low EGA values hints at a critical threshold where perturbations render goal achievement nearly impossible. This could reflect real-world scenarios where resource allocation (required items) and action complexity jointly limit effectiveness.
**Notable Anomaly**: Series D’s abrupt drop at (1,1) (from 0.7 to 0.1) suggests a nonlinear response to initial perturbations, warranting further investigation into its underlying mechanics.