## Heatmap: AUROC for Projections a^Tt
### Overview
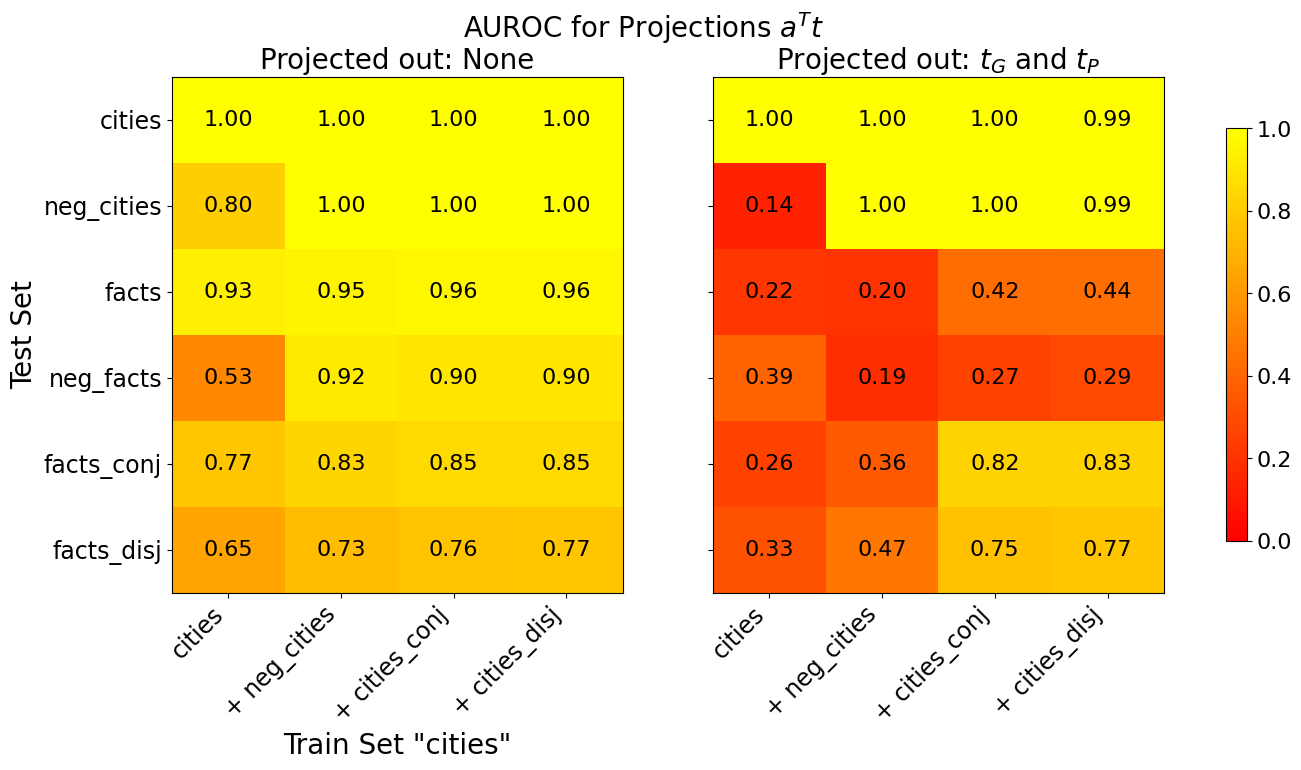
The image presents two heatmaps comparing the Area Under the Receiver Operating Characteristic curve (AUROC) for different projections. The left heatmap shows results when no projections are used ("Projected out: None"), while the right heatmap shows results when projections t_G and t_P are used ("Projected out: t_G and t_P"). The heatmaps compare performance across different test sets (rows) and train sets (columns), with the color intensity indicating the AUROC score.
### Components/Axes
* **Title:** AUROC for Projections a^Tt
* **X-axis (Train Set):** "cities", "+ neg\_cities", "+ cities\_conj", "+ cities\_disj"
* **Y-axis (Test Set):** "cities", "neg\_cities", "facts", "neg\_facts", "facts\_conj", "facts\_disj"
* **Colorbar:** Ranges from 0.0 to 1.0, with colors transitioning from red (low AUROC) to yellow (high AUROC).
* 0.0: Red
* 0.2: Orange-Red
* 0.4: Orange
* 0.6: Yellow-Orange
* 0.8: Yellow
* 1.0: Bright Yellow
* **Heatmap 1 Title:** Projected out: None
* **Heatmap 2 Title:** Projected out: t_G and t_P
### Detailed Analysis
**Heatmap 1: Projected out: None**
| Test Set | cities | + neg\_cities | + cities\_conj | + cities\_disj |
| :---------- | :----- | :------------- | :------------- | :------------- |
| cities | 1.00 | 1.00 | 1.00 | 1.00 |
| neg\_cities | 0.80 | 1.00 | 1.00 | 1.00 |
| facts | 0.93 | 0.95 | 0.96 | 0.96 |
| neg\_facts | 0.53 | 0.92 | 0.90 | 0.90 |
| facts\_conj | 0.77 | 0.83 | 0.85 | 0.85 |
| facts\_disj | 0.65 | 0.73 | 0.76 | 0.77 |
* **cities:** All values are 1.00, indicating perfect performance.
* **neg\_cities:** Starts at 0.80 with "cities" training set, then increases to 1.00 for all other training sets.
* **facts:** Values range from 0.93 to 0.96, showing consistently high performance.
* **neg\_facts:** Starts at 0.53 with "cities" training set, then increases to around 0.90 for other training sets.
* **facts\_conj:** Values range from 0.77 to 0.85.
* **facts\_disj:** Values range from 0.65 to 0.77.
**Heatmap 2: Projected out: t_G and t_P**
| Test Set | cities | + neg\_cities | + cities\_conj | + cities\_disj |
| :---------- | :----- | :------------- | :------------- | :------------- |
| cities | 1.00 | 1.00 | 1.00 | 0.99 |
| neg\_cities | 0.14 | 1.00 | 1.00 | 0.99 |
| facts | 0.22 | 0.20 | 0.42 | 0.44 |
| neg\_facts | 0.39 | 0.19 | 0.27 | 0.29 |
| facts\_conj | 0.26 | 0.36 | 0.82 | 0.83 |
| facts\_disj | 0.33 | 0.47 | 0.75 | 0.77 |
* **cities:** Values are close to 1.00, except for the last value which is 0.99.
* **neg\_cities:** Starts at 0.14 with "cities" training set, then increases to around 1.00 for other training sets.
* **facts:** Values range from 0.20 to 0.44, showing lower performance compared to the "None" projection.
* **neg\_facts:** Values range from 0.19 to 0.39, showing lower performance compared to the "None" projection.
* **facts\_conj:** Values range from 0.26 to 0.83.
* **facts\_disj:** Values range from 0.33 to 0.77.
### Key Observations
* When no projections are used, the model performs very well on the "cities" and "neg\_cities" test sets, achieving near-perfect AUROC scores.
* Projecting out t_G and t_P significantly reduces performance on the "cities" and "neg\_cities" test sets when trained on "cities" alone.
* Training on "+ neg\_cities", "+ cities\_conj", and "+ cities\_disj" generally improves performance compared to training on "cities" alone, especially when projections are used.
* The "facts", "neg\_facts", "facts\_conj", and "facts\_disj" test sets show lower AUROC scores compared to "cities" and "neg\_cities", particularly when projections are used.
### Interpretation
The heatmaps illustrate the impact of projecting out t_G and t_P on the AUROC scores for different test and train set combinations. The results suggest that projecting out these features can significantly degrade performance, especially when the model is trained on a limited dataset like "cities" alone. This indicates that t_G and t_P contain important information for distinguishing between positive and negative examples in the "cities" and "neg\_cities" test sets.
The improved performance when training on combined datasets ("+ neg\_cities", "+ cities\_conj", "+ cities\_disj") suggests that these datasets provide a more diverse and representative training signal, mitigating the negative impact of projecting out t_G and t_P. The lower AUROC scores for the "facts", "neg\_facts", "facts\_conj", and "facts\_disj" test sets may indicate that these datasets are more challenging or require different features for optimal performance.