## Heatmap: AUROC for Projections Aᵀt
### Overview
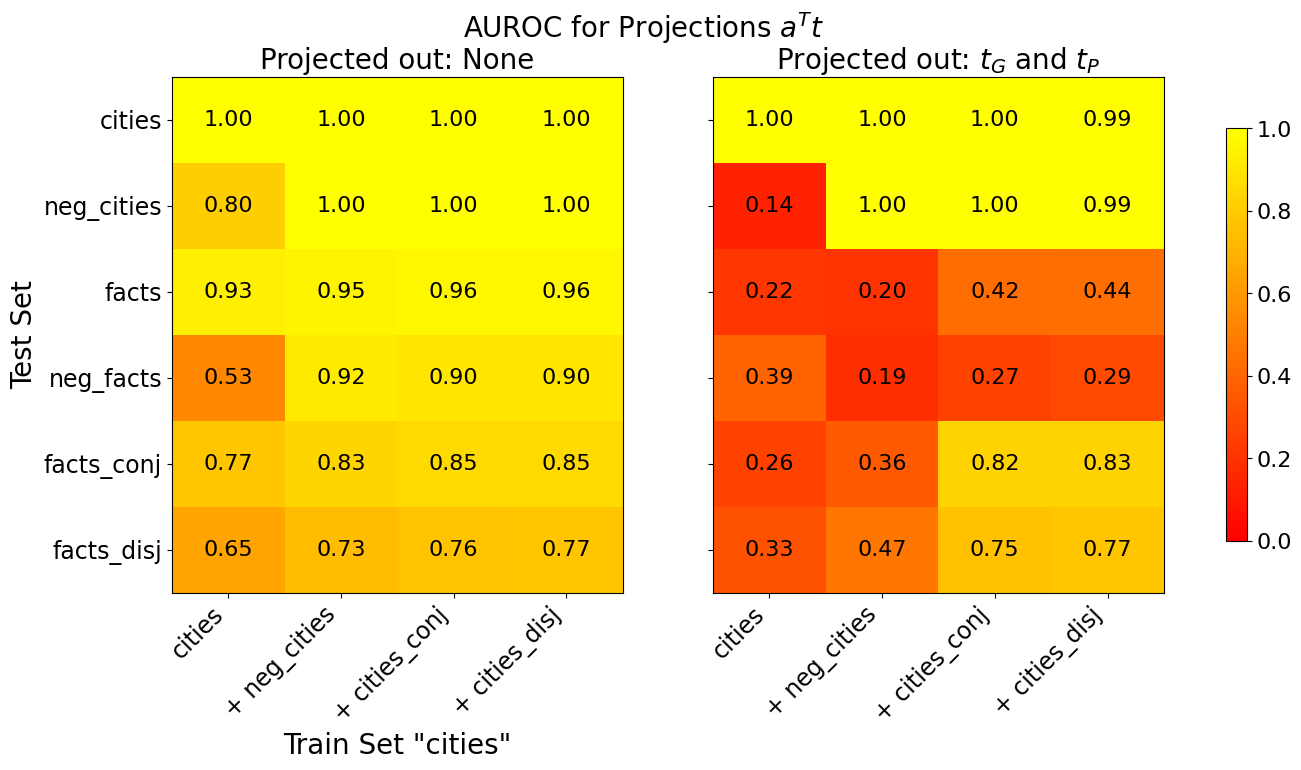
The image presents two heatmaps displaying Area Under the Receiver Operating Characteristic curve (AUROC) values for different combinations of train and test sets. The heatmaps compare performance when projecting out different variables (None vs. τ<sub>G</sub> and τ<sub>P</sub>). The color scale ranges from red (low AUROC, ~0.0) to yellow (high AUROC, ~1.0).
### Components/Axes
* **Title:** "AUROC for Projections Aᵀt"
* **Subtitles:**
* Left: "Projected out: None"
* Right: "Projected out: τ<sub>G</sub> and τ<sub>P</sub>"
* **X-axis (Train Set "cities"):** Categories: "cities", "+ neg\_cities", "+ cities\_conj", "+ cities\_disj"
* **Y-axis (Test Set):** Categories: "cities", "neg\_cities", "facts", "neg\_facts", "facts\_conj", "facts\_disj"
* **Color Scale:** Ranges from approximately 0.0 (red) to 1.0 (yellow). The scale is positioned on the right side of the image.
* **Legend:** Located on the right side of the image, showing the mapping between color and AUROC value.
### Detailed Analysis or Content Details
**Left Heatmap (Projected out: None)**
The left heatmap shows AUROC values when no variables are projected out. The values generally decrease as you move down the Y-axis (from "cities" to "facts\_disj").
* **cities vs. cities:** 1.00
* **cities vs. neg\_cities:** 0.80
* **cities vs. facts:** 0.93
* **cities vs. neg\_facts:** 0.53
* **cities vs. facts\_conj:** 0.77
* **cities vs. facts\_disj:** 0.65
* **+ neg\_cities vs. cities:** 1.00
* **+ neg\_cities vs. neg\_cities:** 1.00
* **+ neg\_cities vs. facts:** 0.95
* **+ neg\_cities vs. neg\_facts:** 0.92
* **+ neg\_cities vs. facts\_conj:** 0.83
* **+ neg\_cities vs. facts\_disj:** 0.73
* **+ cities\_conj vs. cities:** 1.00
* **+ cities\_conj vs. neg\_cities:** 1.00
* **+ cities\_conj vs. facts:** 0.96
* **+ cities\_conj vs. neg\_facts:** 0.90
* **+ cities\_conj vs. facts\_conj:** 0.85
* **+ cities\_conj vs. facts\_disj:** 0.76
* **+ cities\_disj vs. cities:** 1.00
* **+ cities\_disj vs. neg\_cities:** 1.00
* **+ cities\_disj vs. facts:** 0.96
* **+ cities\_disj vs. neg\_facts:** 0.90
* **+ cities\_disj vs. facts\_conj:** 0.85
* **+ cities\_disj vs. facts\_disj:** 0.77
**Right Heatmap (Projected out: τ<sub>G</sub> and τ<sub>P</sub>)**
The right heatmap shows AUROC values when τ<sub>G</sub> and τ<sub>P</sub> are projected out. The values are generally lower than in the left heatmap, especially for combinations involving "facts" and "neg\_facts".
* **cities vs. cities:** 1.00
* **cities vs. neg\_cities:** 0.14
* **cities vs. facts:** 0.22
* **cities vs. neg\_facts:** 0.39
* **cities vs. facts\_conj:** 0.26
* **cities vs. facts\_disj:** 0.33
* **+ neg\_cities vs. cities:** 1.00
* **+ neg\_cities vs. neg\_cities:** 1.00
* **+ neg\_cities vs. facts:** 0.20
* **+ neg\_cities vs. neg\_facts:** 0.19
* **+ neg\_cities vs. facts\_conj:** 0.36
* **+ neg\_cities vs. facts\_disj:** 0.47
* **+ cities\_conj vs. cities:** 1.00
* **+ cities\_conj vs. neg\_cities:** 1.00
* **+ cities\_conj vs. facts:** 0.42
* **+ cities\_conj vs. neg\_facts:** 0.27
* **+ cities\_conj vs. facts\_conj:** 0.82
* **+ cities\_conj vs. facts\_disj:** 0.75
* **+ cities\_disj vs. cities:** 1.00
* **+ cities\_disj vs. neg\_cities:** 1.00
* **+ cities\_disj vs. facts:** 0.44
* **+ cities\_disj vs. neg\_facts:** 0.29
* **+ cities\_disj vs. facts\_conj:** 0.83
* **+ cities\_disj vs. facts\_disj:** 0.77
### Key Observations
* The AUROC values are generally higher when no variables are projected out (left heatmap).
* Projecting out τ<sub>G</sub> and τ<sub>P</sub> significantly reduces the AUROC values, particularly when the test set includes "facts" or "neg\_facts".
* The highest AUROC values are consistently observed when the train and test sets are both "cities".
* The lowest AUROC values in the right heatmap are observed when the test set is "neg\_facts" and the train set is "+ neg\_cities" (0.19).
### Interpretation
The data suggests that the projections τ<sub>G</sub> and τ<sub>P</sub> are important for distinguishing between "cities" and "facts" (or their variations). When these projections are removed, the ability to discriminate between these categories is substantially reduced, as evidenced by the lower AUROC values in the right heatmap. This implies that τ<sub>G</sub> and τ<sub>P</sub> capture information relevant to differentiating between city-related data and factual data.
The consistently high AUROC values when both train and test sets are "cities" indicate that the model performs very well at identifying "cities" within "cities". However, performance degrades when the test set includes "facts" or "neg\_facts", suggesting that the model struggles to generalize to these different data types, especially when τ<sub>G</sub> and τ<sub>P</sub> are removed.
The significant drop in AUROC when projecting out τ<sub>G</sub> and τ<sub>P</sub> for "facts" and "neg\_facts" suggests these projections are crucial for representing the characteristics that distinguish factual information from city-related information. The model relies heavily on these projections to perform well on these types of data.