TECHNICAL ASSET FINGERPRINT
e9a92a55c68c41cd5a9b01ac
Click to view fullscreen
Press ESC or click to close
FOUND IN PAPERS
EXPERT: healer-alpha-free VERSION 1
RUNTIME: free/openrouter/healer-alpha
INTEL_VERIFIED
## Comparative Heatmap Chart: AUROC for Projections a^T t
### Overview
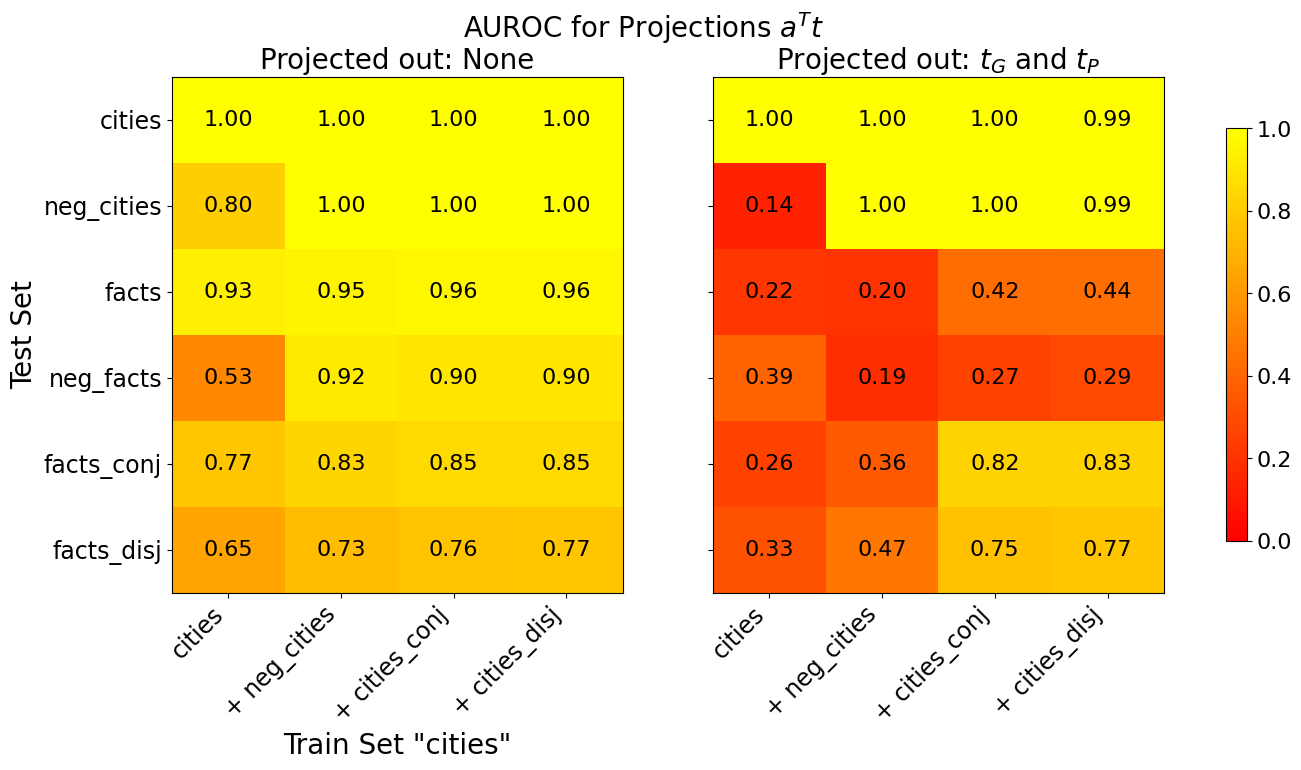
The image displays two side-by-side heatmaps comparing the Area Under the Receiver Operating Characteristic curve (AUROC) performance of a model under two different projection conditions. The overall title is "AUROC for Projections a^T t". The left heatmap shows results when "Projected out: None", and the right heatmap shows results when "Projected out: t_G and t_P". Performance is measured across various test sets when the model is trained on different combinations of data, all based on a core "cities" dataset.
### Components/Axes
* **Main Title:** "AUROC for Projections a^T t" (Top center, spanning both charts).
* **Left Heatmap Subtitle:** "Projected out: None" (Top left).
* **Right Heatmap Subtitle:** "Projected out: t_G and t_P" (Top right).
* **Y-Axis (Both Heatmaps):** Labeled "Test Set". Categories from top to bottom:
* `cities`
* `neg_cities`
* `facts`
* `neg_facts`
* `facts_conj`
* `facts_disj`
* **X-Axis (Both Heatmaps):** Labeled "Train Set 'cities'". Categories from left to right:
* `cities`
* `+ neg_cities`
* `+ cities_conj`
* `+ cities_disj`
* **Color Bar (Right side):** A vertical scale indicating AUROC values. The scale runs from 0.0 (dark red) to 1.0 (bright yellow), with intermediate markers at 0.2, 0.4, 0.6, and 0.8.
### Detailed Analysis
The heatmaps contain numerical AUROC values in each cell. Values are transcribed below with the format: `[Test Set] | [Train Set Condition]: [AUROC Value]`.
**Left Heatmap (Projected out: None):**
* **cities:** `cities`: 1.00 | `+ neg_cities`: 1.00 | `+ cities_conj`: 1.00 | `+ cities_disj`: 1.00
* **neg_cities:** `cities`: 0.80 | `+ neg_cities`: 1.00 | `+ cities_conj`: 1.00 | `+ cities_disj`: 1.00
* **facts:** `cities`: 0.93 | `+ neg_cities`: 0.95 | `+ cities_conj`: 0.96 | `+ cities_disj`: 0.96
* **neg_facts:** `cities`: 0.53 | `+ neg_cities`: 0.92 | `+ cities_conj`: 0.90 | `+ cities_disj`: 0.90
* **facts_conj:** `cities`: 0.77 | `+ neg_cities`: 0.83 | `+ cities_conj`: 0.85 | `+ cities_disj`: 0.85
* **facts_disj:** `cities`: 0.65 | `+ neg_cities`: 0.73 | `+ cities_conj`: 0.76 | `+ cities_disj`: 0.77
**Right Heatmap (Projected out: t_G and t_P):**
* **cities:** `cities`: 1.00 | `+ neg_cities`: 1.00 | `+ cities_conj`: 1.00 | `+ cities_disj`: 0.99
* **neg_cities:** `cities`: 0.14 | `+ neg_cities`: 1.00 | `+ cities_conj`: 1.00 | `+ cities_disj`: 0.99
* **facts:** `cities`: 0.22 | `+ neg_cities`: 0.20 | `+ cities_conj`: 0.42 | `+ cities_disj`: 0.44
* **neg_facts:** `cities`: 0.39 | `+ neg_cities`: 0.19 | `+ cities_conj`: 0.27 | `+ cities_disj`: 0.29
* **facts_conj:** `cities`: 0.26 | `+ neg_cities`: 0.36 | `+ cities_conj`: 0.82 | `+ cities_disj`: 0.83
* **facts_disj:** `cities`: 0.33 | `+ neg_cities`: 0.47 | `+ cities_conj`: 0.75 | `+ cities_disj`: 0.77
### Key Observations
1. **Performance Collapse with Projection:** The most striking pattern is the dramatic drop in AUROC for most test sets when moving from the left heatmap (no projection) to the right heatmap (projecting out t_G and t_P). This is visually represented by the shift from predominantly yellow cells to predominantly red/orange cells.
2. **Robustness of the `cities` Test Set:** The `cities` test set maintains near-perfect performance (AUROC ≈ 1.00) across all training conditions in both projection settings. It is the only test set unaffected by the projection.
3. **Impact on Negated Data:** The `neg_cities` test set shows extreme sensitivity. Without projection, training on `cities` alone yields a moderate 0.80, which improves to 1.00 with additional data. With projection, training on `cities` alone collapses to 0.14 (worse than random), but recovers to 1.00 when `neg_cities` is included in the training set.
4. **Generalization to "facts":** Performance on the `facts` and `neg_facts` test sets is generally high without projection but suffers severely with projection, especially when the training set is limited to `cities` or `+ neg_cities`. Including conjunctive/disjunctive data (`+ cities_conj`, `+ cities_disj`) provides partial recovery.
5. **Conjunctive/Disjunctive Test Sets:** The `facts_conj` and `facts_disj` test sets show a similar pattern: poor performance with projection when trained on basic sets, but significant recovery (AUROC > 0.75) when the training set includes the corresponding conjunctive or disjunctive data (`+ cities_conj` or `+ cities_disj`).
### Interpretation
This chart investigates the role of specific model components or directions, denoted as `t_G` and `t_P`, in generalization. The "projection out" operation likely removes the influence of these components from the model's representations.
* **Core Finding:** The components `t_G` and `t_P` appear to be **critical for generalization** beyond the specific `cities` task. Their removal (right heatmap) causes performance to plummet on all test sets except the in-distribution `cities` set. This suggests these components encode broad, transferable knowledge.
* **Task-Specific vs. General Knowledge:** The model's perfect performance on `cities` even after projection indicates that knowledge specific to that task is stored in other components. The catastrophic failure on `neg_cities` (when trained only on `cities`) after projection implies that understanding negation relies heavily on these general components (`t_G`, `t_P`).
* **Data Efficiency and Compositionality:** Including negated or compositional data (`+ neg_cities`, `+ cities_conj`, etc.) in training can compensate for the loss of `t_G` and `t_P` to a significant degree. This demonstrates that the model can learn these reasoning skills directly from data, but under normal conditions (left heatmap), it preferentially uses the more efficient, general-purpose `t_G` and `t_P` components.
* **Peircean Investigation:** The chart acts as a diagnostic tool. By systematically removing components (`t_G`, `t_P`) and testing on varied logical forms (negation, conjunction, disjunction), the researchers can ablate and identify which parts of the model are responsible for which reasoning capabilities. The stark contrast between the two heatmaps provides strong evidence that `t_G` and `t_P` are not merely task-specific features but are fundamental to the model's ability to generalize its understanding.
DECODING INTELLIGENCE...