## Heatmap: AUROC for Projections a^Tt
### Overview
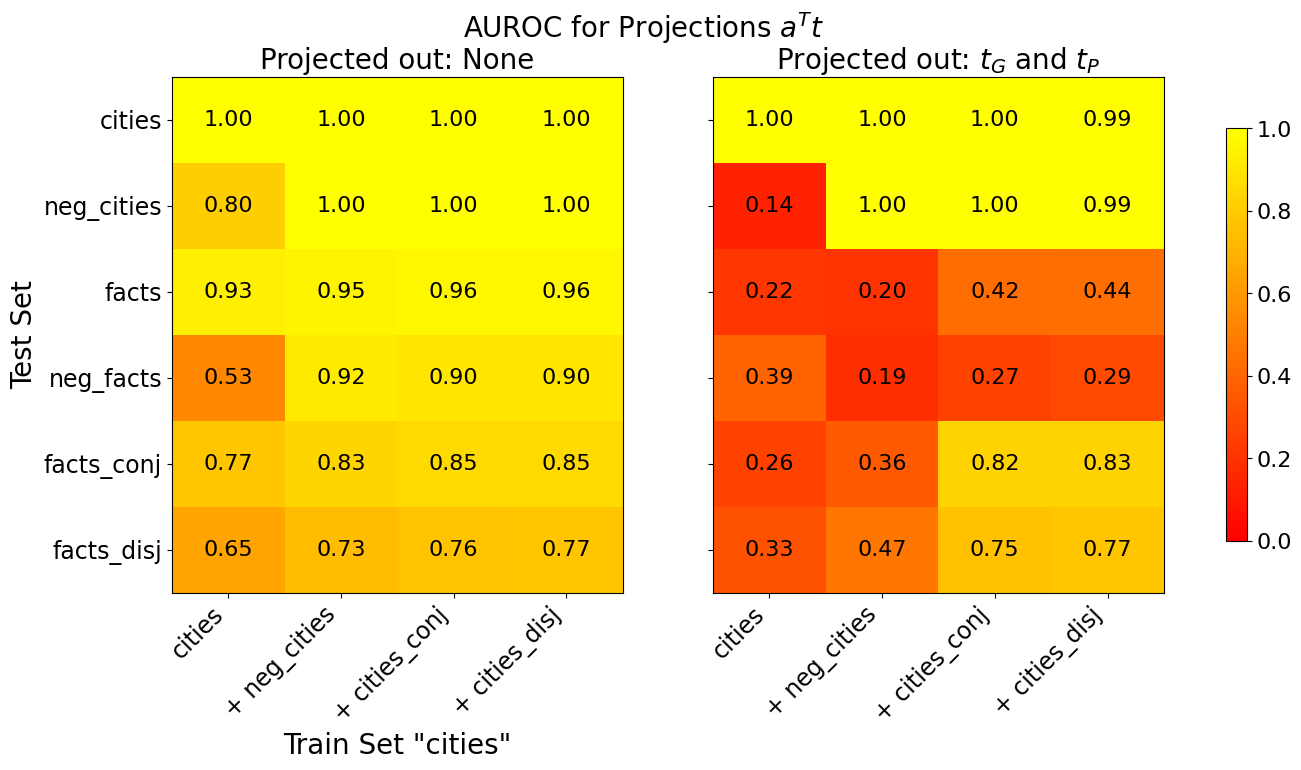
The image presents two side-by-side heatmaps comparing the Area Under the Receiver Operating Characteristic (AUROC) values for different test and train set combinations under two projection scenarios: "Projected out: None" (left) and "Projected out: t_G and t_P" (right). The heatmaps use a color gradient from red (low AUROC) to yellow (high AUROC) to represent performance metrics.
---
### Components/Axes
- **X-axis (Train Set "cities")**:
- Categories: `cities`, `+ neg_cities`, `+ cities_conj`, `+ cities_disj`
- **Y-axis (Test Set)**:
- Categories: `cities`, `neg_cities`, `facts`, `neg_facts`, `facts_conj`, `facts_disj`
- **Legend**:
- Vertical color bar on the right with values from 0.0 (red) to 1.0 (yellow).
- **Main Title**: "AUROC for Projections a^Tt"
- **Subtitles**:
- Left: "Projected out: None"
- Right: "Projected out: t_G and t_P"
---
### Detailed Analysis
#### Left Section ("Projected out: None")
| Test Set \ Train Set | cities | + neg_cities | + cities_conj | + cities_disj |
|----------------------|--------|--------------|---------------|---------------|
| **cities** | 1.00 | 1.00 | 1.00 | 1.00 |
| **neg_cities** | 0.80 | 1.00 | 1.00 | 1.00 |
| **facts** | 0.93 | 0.95 | 0.96 | 0.96 |
| **neg_facts** | 0.53 | 0.92 | 0.90 | 0.90 |
| **facts_conj** | 0.77 | 0.83 | 0.85 | 0.85 |
| **facts_disj** | 0.65 | 0.73 | 0.76 | 0.77 |
#### Right Section ("Projected out: t_G and t_P")
| Test Set \ Train Set | cities | + neg_cities | + cities_conj | + cities_disj |
|----------------------|--------|--------------|---------------|---------------|
| **cities** | 1.00 | 1.00 | 1.00 | 0.99 |
| **neg_cities** | 0.14 | 1.00 | 1.00 | 0.99 |
| **facts** | 0.22 | 0.20 | 0.42 | 0.44 |
| **neg_facts** | 0.39 | 0.19 | 0.27 | 0.29 |
| **facts_conj** | 0.26 | 0.36 | 0.82 | 0.83 |
| **facts_disj** | 0.33 | 0.47 | 0.75 | 0.77 |
---
### Key Observations
1. **High AUROC in "Projected out: None"**:
- All test sets achieve near-perfect AUROC (1.00) when trained on `cities` and `+ neg_cities` in the left section.
- Negative categories (`neg_cities`, `neg_facts`) show moderate to high performance (0.53–0.92).
2. **Significant Drop in "Projected out: t_G and t_P"**:
- **Negative categories** (e.g., `neg_cities`, `neg_facts`) experience drastic declines:
- `neg_cities` drops from 0.80 (left) to 0.14 (right).
- `neg_facts` drops from 0.53 (left) to 0.39 (right).
- **Positive categories** (e.g., `cities`, `facts`) also decline but less severely:
- `facts` drops from 0.93 (left) to 0.22 (right).
- **Conjunction/disjunction categories** (`facts_conj`, `facts_disj`) show mixed results, with `facts_conj` improving slightly in the right section (0.82 vs. 0.77).
3. **Color Gradient Consistency**:
- Red cells (low AUROC) dominate the right section for negative categories, while yellow cells (high AUROC) dominate the left section.
---
### Interpretation
- **Impact of Projection**: Projecting out `t_G` and `t_P` severely degrades the model's ability to distinguish negative instances (`neg_cities`, `neg_facts`), suggesting these features are critical for performance.
- **Stability of Positive Categories**: `cities` and `facts` retain higher AUROC values even after projection, indicating robustness in positive class discrimination.
- **Conjunction/Disjunction Behavior**: The improvement in `facts_conj` and `facts_disj` under projection might reflect reduced noise or overfitting, but this is offset by the loss in negative class performance.
- **Practical Implications**: The model's reliance on `t_G` and `t_P` for negative class discrimination highlights a potential vulnerability in scenarios where these features are removed.
This analysis underscores the trade-off between feature projection and model performance, emphasizing the importance of retaining key features for negative class tasks.