## Grouped Bar Chart: Accuracy Comparison of Three Methods Across Seven Categories
### Overview
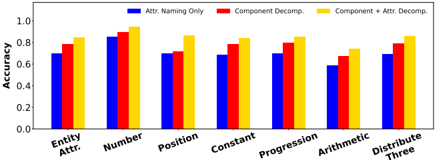
This image displays a grouped bar chart comparing the accuracy of three different methods ("Attr. Naming Only", "Component Decomp.", and "Component + Attr. Decomp.") across seven distinct categories. The chart is designed to show performance differences, with the y-axis representing accuracy on a scale from 0.0 to 1.0.
### Components/Axes
* **Chart Type:** Grouped Bar Chart.
* **Y-Axis:**
* **Label:** "Accuracy"
* **Scale:** Linear, ranging from 0.0 to 1.0, with major tick marks at 0.0, 0.2, 0.4, 0.6, 0.8, and 1.0.
* **X-Axis:**
* **Categories (from left to right):** "Entity Attr.", "Number", "Position", "Constant", "Progression", "Arithmetic", "Distribute Three".
* **Legend:**
* **Position:** Top center of the chart area.
* **Entries:**
1. **Blue Bar:** "Attr. Naming Only"
2. **Red Bar:** "Component Decomp."
3. **Yellow Bar:** "Component + Attr. Decomp."
### Detailed Analysis
The chart presents a side-by-side comparison for each category. The general visual trend is that the yellow bars ("Component + Attr. Decomp.") are consistently the tallest, followed by the red bars ("Component Decomp."), with the blue bars ("Attr. Naming Only") being the shortest in every category.
**Category-by-Category Breakdown (Approximate Values):**
1. **Entity Attr.**
* Blue (Attr. Naming Only): ~0.70
* Red (Component Decomp.): ~0.78
* Yellow (Component + Attr. Decomp.): ~0.85
2. **Number**
* Blue: ~0.85
* Red: ~0.90
* Yellow: ~0.95
3. **Position**
* Blue: ~0.70
* Red: ~0.75
* Yellow: ~0.85
4. **Constant**
* Blue: ~0.70
* Red: ~0.80
* Yellow: ~0.85
5. **Progression**
* Blue: ~0.70
* Red: ~0.80
* Yellow: ~0.85
6. **Arithmetic**
* Blue: ~0.60
* Red: ~0.70
* Yellow: ~0.75
7. **Distribute Three**
* Blue: ~0.70
* Red: ~0.80
* Yellow: ~0.85
### Key Observations
* **Consistent Hierarchy:** In all seven categories, the performance order is identical: "Component + Attr. Decomp." (Yellow) > "Component Decomp." (Red) > "Attr. Naming Only" (Blue).
* **Highest Performance:** The "Number" category shows the highest accuracy scores for all three methods, with the yellow bar approaching 0.95.
* **Lowest Performance:** The "Arithmetic" category shows the lowest accuracy scores for all three methods, with the blue bar at approximately 0.60.
* **Performance Gap:** The gap between the best (yellow) and worst (blue) method is most pronounced in the "Entity Attr." and "Position" categories (a difference of ~0.15) and smallest in the "Number" category (a difference of ~0.10).
* **Stability of Improvement:** The incremental gain from "Attr. Naming Only" (Blue) to "Component Decomp." (Red) appears relatively consistent across categories, as does the further gain to "Component + Attr. Decomp." (Yellow).
### Interpretation
The data strongly suggests that the method "Component + Attr. Decomp." is the most effective approach for the task measured, yielding the highest accuracy across all tested categories. The "Component Decomp." method provides a clear improvement over the baseline "Attr. Naming Only," and combining it with attribute decomposition yields further benefits.
The fact that the hierarchy is preserved across diverse categories (from "Entity Attr." to "Arithmetic") indicates that the advantage of the more complex methods is robust and not specific to a single type of problem. The "Number" category being the easiest and "Arithmetic" the hardest for all methods might reflect inherent differences in the complexity or learnability of these concepts within the evaluated system.
This chart likely comes from a research paper or technical report in fields like machine learning, cognitive science, or program synthesis, where different representation or decomposition strategies are being evaluated on a suite of diagnostic tasks. The clear, consistent trend provides strong evidence for the efficacy of the combined decomposition approach.