## Line Charts: Performance Comparison of Different Methods
### Overview
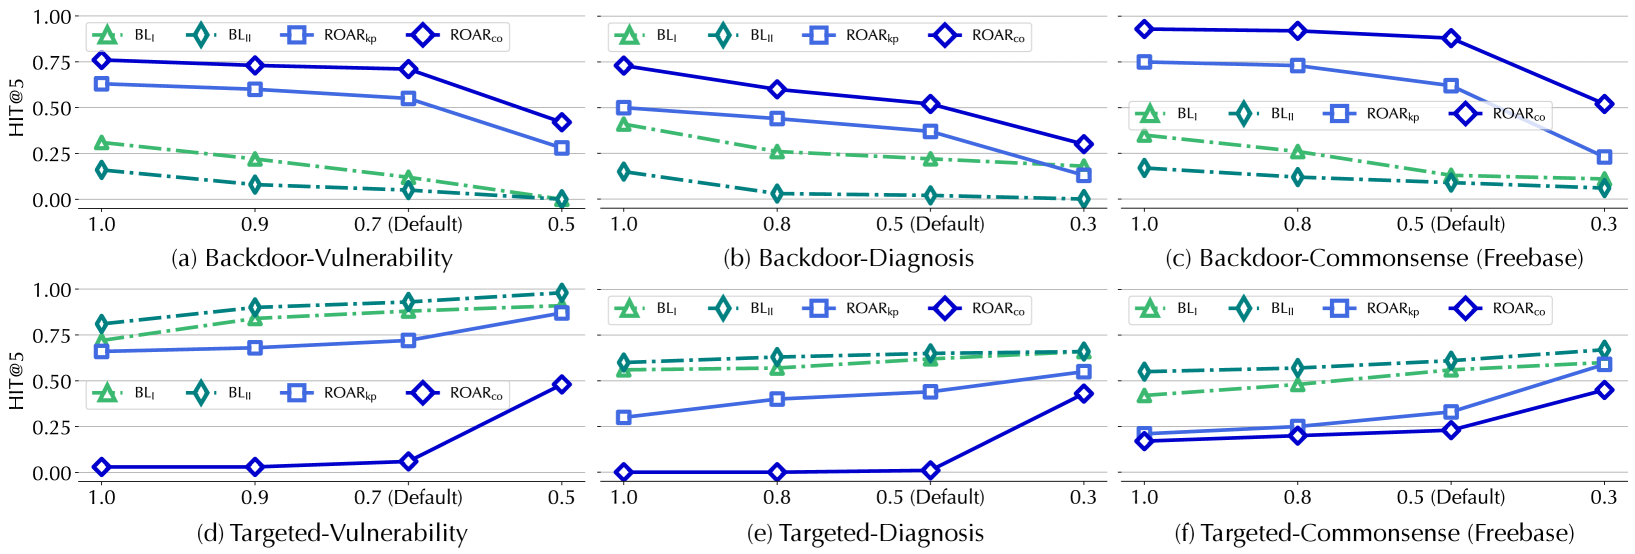
The image presents six line charts comparing the performance of four different methods (BLI, BLII, ROARkp, and ROARco) across various tasks: Backdoor-Vulnerability, Backdoor-Diagnosis, Backdoor-Commonsense (Freebase), Targeted-Vulnerability, Targeted-Diagnosis, and Targeted-Commonsense (Freebase). The x-axis represents different settings or configurations, while the y-axis represents the HIT@5 metric, indicating the hit rate at the top 5 predictions.
### Components/Axes
* **Y-axis:** HIT@5, ranging from 0.00 to 1.00 with increments of 0.25.
* **X-axis:** Discrete values representing different settings, labeled as 1.0, 0.9, 0.7 (Default), 0.5 for the first chart; 1.0, 0.8, 0.5 (Default), 0.3 for the second and third charts; 1.0, 0.9, 0.7 (Default), 0.5 for the fourth chart; 1.0, 0.8, 0.5 (Default), 0.3 for the fifth and sixth charts.
* **Legends (positioned at the top of each chart):**
* Green triangle marker: BLI
* Teal diamond marker: BLII
* Light Blue square marker: ROARkp
* Dark Blue diamond marker: ROARco
* **Chart Titles (positioned below each chart):**
* (a) Backdoor-Vulnerability
* (b) Backdoor-Diagnosis
* (c) Backdoor-Commonsense (Freebase)
* (d) Targeted-Vulnerability
* (e) Targeted-Diagnosis
* (f) Targeted-Commonsense (Freebase)
### Detailed Analysis
**Chart (a) Backdoor-Vulnerability:**
* **BLI (Green, Triangle):** Decreases from approximately 0.32 to 0.15.
* **BLII (Teal, Diamond):** Decreases from approximately 0.20 to 0.05.
* **ROARkp (Light Blue, Square):** Decreases from approximately 0.65 to 0.30.
* **ROARco (Dark Blue, Diamond):** Decreases from approximately 0.80 to 0.40.
**Chart (b) Backdoor-Diagnosis:**
* **BLI (Green, Triangle):** Decreases from approximately 0.35 to 0.10.
* **BLII (Teal, Diamond):** Decreases from approximately 0.20 to 0.05.
* **ROARkp (Light Blue, Square):** Decreases from approximately 0.75 to 0.25.
* **ROARco (Dark Blue, Diamond):** Decreases from approximately 0.75 to 0.35.
**Chart (c) Backdoor-Commonsense (Freebase):**
* **BLI (Green, Triangle):** Decreases from approximately 0.30 to 0.10.
* **BLII (Teal, Diamond):** Decreases from approximately 0.20 to 0.10.
* **ROARkp (Light Blue, Square):** Decreases from approximately 0.75 to 0.60.
* **ROARco (Dark Blue, Diamond):** Decreases from approximately 0.80 to 0.75.
**Chart (d) Targeted-Vulnerability:**
* **BLI (Green, Triangle):** Increases from approximately 0.75 to 0.95.
* **BLII (Teal, Diamond):** Increases from approximately 0.80 to 0.95.
* **ROARkp (Light Blue, Square):** Remains relatively constant at approximately 0.70.
* **ROARco (Dark Blue, Diamond):** Increases from approximately 0.02 to 0.50.
**Chart (e) Targeted-Diagnosis:**
* **BLI (Green, Triangle):** Increases from approximately 0.75 to 0.95.
* **BLII (Teal, Diamond):** Increases from approximately 0.80 to 0.95.
* **ROARkp (Light Blue, Square):** Increases from approximately 0.65 to 0.70.
* **ROARco (Dark Blue, Diamond):** Increases from approximately 0.02 to 0.70.
**Chart (f) Targeted-Commonsense (Freebase):**
* **BLI (Green, Triangle):** Increases from approximately 0.50 to 0.60.
* **BLII (Teal, Diamond):** Increases from approximately 0.50 to 0.65.
* **ROARkp (Light Blue, Square):** Increases from approximately 0.20 to 0.65.
* **ROARco (Dark Blue, Diamond):** Increases from approximately 0.20 to 0.70.
### Key Observations
* ROARco generally starts with the highest HIT@5 in Backdoor tasks but decreases as the x-axis value decreases.
* In Targeted tasks, ROARco starts with the lowest HIT@5 but increases significantly as the x-axis value decreases.
* BLI and BLII generally have lower HIT@5 values compared to ROARkp and ROARco in Backdoor tasks.
* BLI and BLII generally have higher HIT@5 values compared to ROARco in Targeted tasks.
* ROARkp shows a relatively stable performance across different x-axis values in Targeted tasks.
### Interpretation
The charts illustrate the performance of different methods in detecting and mitigating vulnerabilities and biases in models. The "Backdoor" tasks likely involve identifying vulnerabilities intentionally inserted into the model, while "Targeted" tasks may involve identifying vulnerabilities related to specific target groups or scenarios.
The data suggests that ROARco is effective in identifying backdoor vulnerabilities when the setting is at its default (0.7 or 0.5), but its performance degrades as the setting changes. Conversely, in targeted scenarios, ROARco's performance improves significantly as the setting changes, indicating its adaptability to specific target groups or scenarios. BLI and BLII show relatively consistent performance across different settings, but their overall HIT@5 values are generally lower than ROARkp and ROARco.
The differences in performance between the methods and tasks highlight the importance of selecting the appropriate method based on the specific type of vulnerability or bias being addressed. The "default" setting on the x-axis likely represents a standard configuration, while the other values represent variations or adjustments to the setting. The trends suggest that some methods are more sensitive to these adjustments than others.