## Line Charts: Performance Evaluation of ROAR and Baseline Methods
### Overview
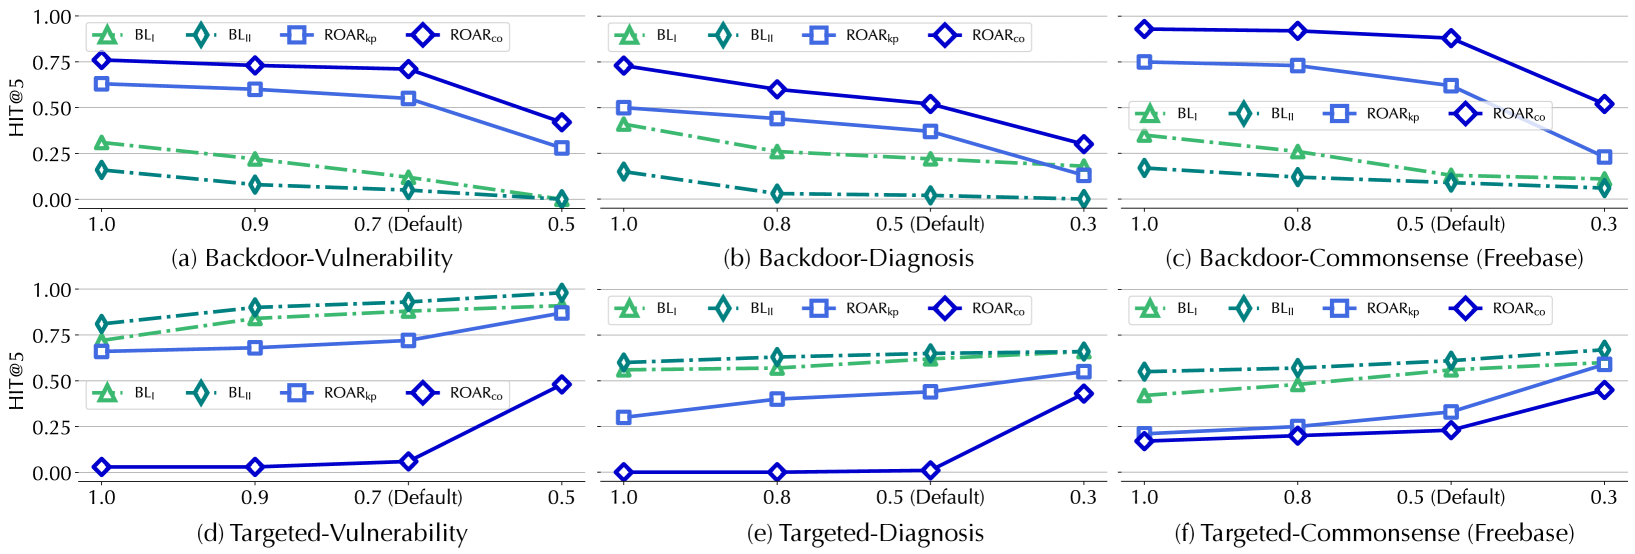
This image displays a 2x3 grid of six line charts comparing the performance of four different methods ($BL_I$, $BL_{II}$, $ROAR_{kp}$, and $ROAR_{co}$) across two distinct task categories: "Backdoor" (top row) and "Targeted" (bottom row). Each row contains three sub-tasks: Vulnerability, Diagnosis, and Commonsense (Freebase). The Y-axis represents "HIT@5" performance, while the X-axis represents a variable parameter (likely a pruning or threshold ratio) decreasing from left to right.
### Components/Axes
* **Y-Axis:** Labeled "HIT@5" for all charts. The scale ranges from 0.00 to 1.00.
* **X-Axis:** Represents a parameter value.
* Charts (a) and (d): 1.0, 0.9, 0.7 (Default), 0.5.
* Charts (b), (c), (e), and (f): 1.0, 0.8, 0.5 (Default), 0.3.
* **Legend (Top of each chart):**
* **$BL_I$**: Green triangle marker, dashed line.
* **$BL_{II}$**: Teal diamond marker, dash-dot line.
* **$ROAR_{kp}$**: Light blue square marker, solid line.
* **$ROAR_{co}$**: Dark blue diamond marker, solid line.
---
### Detailed Analysis
#### Row 1: Backdoor Scenarios
*Trends: All four methods show a downward trend as the X-axis parameter decreases from 1.0 to the minimum value.*
* **(a) Backdoor-Vulnerability:**
* $ROAR_{co}$ starts highest (~0.75) and drops to ~0.4.
* $ROAR_{kp}$ starts ~0.65 and drops to ~0.3.
* $BL_I$ starts ~0.3 and drops to ~0.0.
* $BL_{II}$ starts ~0.15 and drops to ~0.0.
* **(b) Backdoor-Diagnosis:**
* $ROAR_{co}$ starts ~0.75 and drops to ~0.3.
* $ROAR_{kp}$ starts ~0.5 and drops to ~0.15.
* $BL_I$ starts ~0.4 and drops to ~0.0.
* $BL_{II}$ starts ~0.15 and drops to ~0.0.
* **(c) Backdoor-Commonsense (Freebase):**
* $ROAR_{co}$ starts highest (~0.95) and drops to ~0.5.
* $ROAR_{kp}$ starts ~0.75 and drops to ~0.25.
* $BL_I$ starts ~0.35 and drops to ~0.1.
* $BL_{II}$ starts ~0.15 and drops to ~0.05.
#### Row 2: Targeted Scenarios
*Trends: All four methods show an upward trend as the X-axis parameter decreases from 1.0 to the minimum value.*
* **(d) Targeted-Vulnerability:**
* $BL_{II}$ starts ~0.8 and rises to ~1.0.
* $BL_I$ starts ~0.7 and rises to ~0.9.
* $ROAR_{kp}$ starts ~0.65 and rises to ~0.85.
* $ROAR_{co}$ starts ~0.0 and rises to ~0.5.
* **(e) Targeted-Diagnosis:**
* $BL_{II}$ starts ~0.6 and rises to ~0.65.
* $BL_I$ starts ~0.55 and rises to ~0.65.
* $ROAR_{kp}$ starts ~0.3 and rises to ~0.55.
* $ROAR_{co}$ starts ~0.0 and rises to ~0.45.
* **(f) Targeted-Commonsense (Freebase):**
* $BL_{II}$ starts ~0.55 and rises to ~0.65.
* $BL_I$ starts ~0.4 and rises to ~0.6.
* $ROAR_{kp}$ starts ~0.2 and rises to ~0.6.
* $ROAR_{co}$ starts ~0.15 and rises to ~0.45.
---
### Key Observations
1. **Inverse Relationship:** The "Backdoor" tasks and "Targeted" tasks exhibit opposite performance behaviors relative to the parameter change. Backdoor performance degrades as the parameter decreases, while Targeted performance improves as the parameter decreases.
2. **Method Sensitivity:** $ROAR_{co}$ (Dark Blue) is consistently the most sensitive method, showing the steepest slopes in both directions (highest peaks in Backdoor, lowest troughs in Targeted).
3. **Baseline Stability:** $BL_I$ and $BL_{II}$ (Green/Teal) are generally more stable across the parameter range compared to the $ROAR$ methods.
4. **Performance Crossover:** In the Targeted scenarios (bottom row), the $ROAR$ methods start with very low performance (near 0.0 in some cases) but improve significantly as the parameter decreases, eventually approaching the performance levels of the $BL$ methods.
### Interpretation
The data suggests that the parameter being adjusted on the X-axis acts as a "sensitivity" or "filtering" control.
* **For Backdoor tasks:** The methods rely on the parameter to maintain high performance. Reducing the parameter likely removes critical information or "backdoor" triggers, causing a sharp decline in HIT@5 scores.
* **For Targeted tasks:** The methods appear to be hindered by the parameter at higher values (1.0). Reducing the parameter likely removes noise or irrelevant data, allowing the models to focus on the target, thereby increasing performance.
* **Peircean Investigative Note:** The stark contrast between the two rows indicates that the underlying mechanism for "Backdoor" detection and "Targeted" detection are fundamentally different in their data requirements. The $ROAR$ methods are highly dynamic, suggesting they are more adaptive to the parameter tuning than the static $BL$ baselines, which maintain a more consistent, albeit sometimes lower, performance profile.