TECHNICAL ASSET FINGERPRINT
e9b8ab1b90c033342159c439
Click to view fullscreen
Press ESC or click to close
FOUND IN PAPERS
EXPERT: gemma-3-27b-it-free VERSION 1
RUNTIME: google-free/gemma-3-27b-it
INTEL_VERIFIED
## Line Charts: Performance Comparison of Backdoor Attacks and Defenses
### Overview
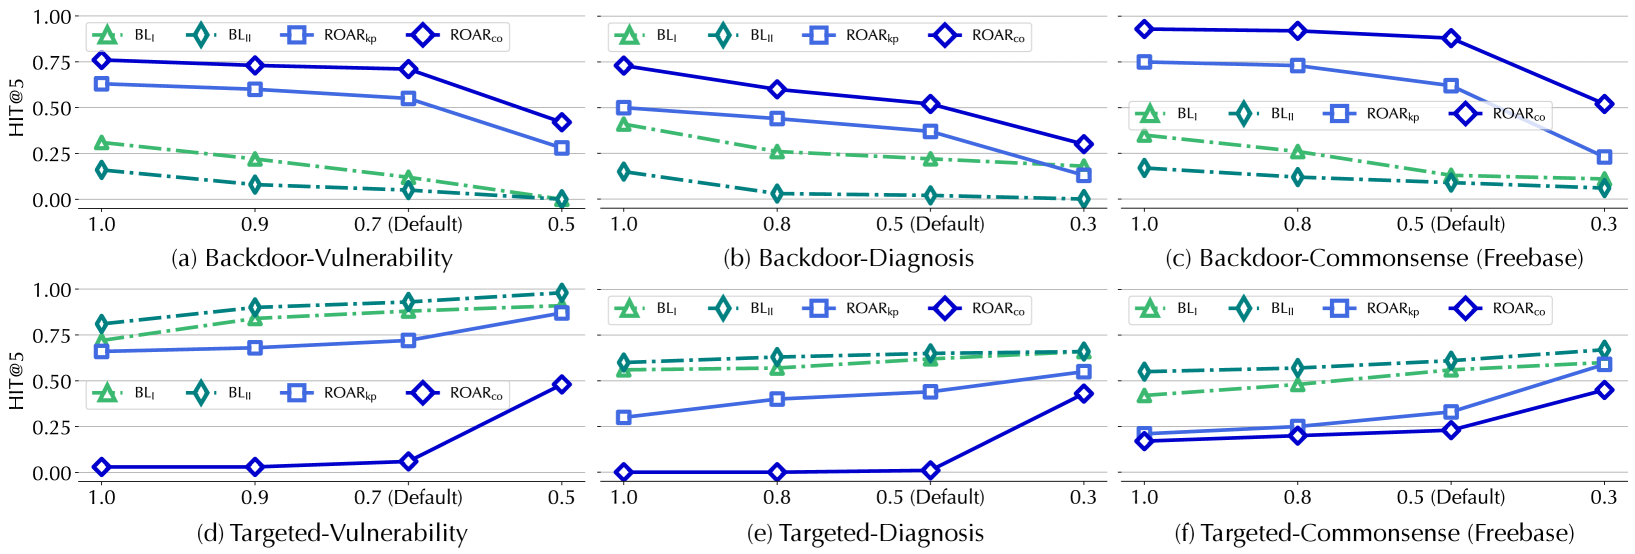
The image presents six line charts, arranged in a 2x3 grid, comparing the performance of different backdoor attack and defense strategies. The charts plot HIT@5 (Hit Rate at 5) against varying attack strengths (represented by values 1.0, 0.9, 0.7, and 0.5, with "0.7 (Default)" also indicated on the x-axis). The strategies being compared are BL<sub>I</sub>, BL<sub>II</sub>, ROAR<sub>I</sub><sub>p</sub>, and ROAR<sub>CD</sub>. Each chart focuses on a specific scenario: Backdoor-Vulnerability, Backdoor-Diagnosis, Backdoor-Commonsense (Freebase), Targeted-Vulnerability, Targeted-Diagnosis, and Targeted-Commonsense (Freebase).
### Components/Axes
* **X-axis:** Attack Strength (values: 0.3, 0.5, 0.7 (Default), 0.8, 0.9, 1.0).
* **Y-axis:** HIT@5 (Hit Rate at 5), ranging from 0.00 to 1.00.
* **Lines:** Represent different attack/defense strategies:
* BL<sub>I</sub> (Blue Solid Line)
* BL<sub>II</sub> (Blue Dashed Line)
* ROAR<sub>I</sub><sub>p</sub> (Green Triangle Dashed Line)
* ROAR<sub>CD</sub> (Yellow Diamond Solid Line)
* **Legend:** Located at the top-left of each chart, indicating the color and line style corresponding to each strategy.
* **Chart Titles:** Located below each chart, identifying the specific scenario being evaluated (e.g., "(a) Backdoor-Vulnerability").
### Detailed Analysis or Content Details
**Chart (a) Backdoor-Vulnerability:**
* BL<sub>I</sub>: Starts at approximately 0.75 at x=1.0, decreases to approximately 0.55 at x=0.9, remains relatively stable around 0.55-0.60 between x=0.7 and x=0.5.
* BL<sub>II</sub>: Starts at approximately 0.70 at x=1.0, decreases to approximately 0.50 at x=0.9, remains relatively stable around 0.45-0.50 between x=0.7 and x=0.5.
* ROAR<sub>I</sub><sub>p</sub>: Starts at approximately 0.25 at x=1.0, increases to approximately 0.35 at x=0.9, remains relatively stable around 0.30-0.35 between x=0.7 and x=0.5.
* ROAR<sub>CD</sub>: Starts at approximately 0.05 at x=1.0, increases to approximately 0.15 at x=0.9, remains relatively stable around 0.10-0.15 between x=0.7 and x=0.5.
**Chart (b) Backdoor-Diagnosis:**
* BL<sub>I</sub>: Starts at approximately 0.80 at x=1.0, decreases to approximately 0.60 at x=0.8, decreases to approximately 0.40 at x=0.5.
* BL<sub>II</sub>: Starts at approximately 0.75 at x=1.0, decreases to approximately 0.55 at x=0.8, decreases to approximately 0.35 at x=0.5.
* ROAR<sub>I</sub><sub>p</sub>: Starts at approximately 0.30 at x=1.0, decreases to approximately 0.20 at x=0.8, decreases to approximately 0.10 at x=0.5.
* ROAR<sub>CD</sub>: Starts at approximately 0.05 at x=1.0, remains relatively stable around 0.05-0.10 between x=0.8 and x=0.5.
**Chart (c) Backdoor-Commonsense (Freebase):**
* BL<sub>I</sub>: Starts at approximately 0.80 at x=1.0, decreases to approximately 0.60 at x=0.8, decreases to approximately 0.40 at x=0.3.
* BL<sub>II</sub>: Starts at approximately 0.75 at x=1.0, decreases to approximately 0.55 at x=0.8, decreases to approximately 0.35 at x=0.3.
* ROAR<sub>I</sub><sub>p</sub>: Starts at approximately 0.30 at x=1.0, decreases to approximately 0.20 at x=0.8, decreases to approximately 0.10 at x=0.3.
* ROAR<sub>CD</sub>: Starts at approximately 0.05 at x=1.0, remains relatively stable around 0.05-0.10 between x=0.8 and x=0.3.
**Chart (d) Targeted-Vulnerability:**
* BL<sub>I</sub>: Starts at approximately 0.80 at x=1.0, decreases to approximately 0.60 at x=0.9, decreases to approximately 0.40 at x=0.5.
* BL<sub>II</sub>: Starts at approximately 0.75 at x=1.0, decreases to approximately 0.55 at x=0.9, decreases to approximately 0.35 at x=0.5.
* ROAR<sub>I</sub><sub>p</sub>: Starts at approximately 0.25 at x=1.0, increases to approximately 0.35 at x=0.9, decreases to approximately 0.25 at x=0.5.
* ROAR<sub>CD</sub>: Starts at approximately 0.05 at x=1.0, increases to approximately 0.15 at x=0.9, decreases to approximately 0.10 at x=0.5.
**Chart (e) Targeted-Diagnosis:**
* BL<sub>I</sub>: Starts at approximately 0.80 at x=1.0, decreases to approximately 0.60 at x=0.8, decreases to approximately 0.40 at x=0.5.
* BL<sub>II</sub>: Starts at approximately 0.75 at x=1.0, decreases to approximately 0.55 at x=0.8, decreases to approximately 0.35 at x=0.5.
* ROAR<sub>I</sub><sub>p</sub>: Starts at approximately 0.30 at x=1.0, decreases to approximately 0.20 at x=0.8, decreases to approximately 0.10 at x=0.5.
* ROAR<sub>CD</sub>: Starts at approximately 0.05 at x=1.0, remains relatively stable around 0.05-0.10 between x=0.8 and x=0.5.
**Chart (f) Targeted-Commonsense (Freebase):**
* BL<sub>I</sub>: Starts at approximately 0.80 at x=1.0, decreases to approximately 0.60 at x=0.8, decreases to approximately 0.40 at x=0.3.
* BL<sub>II</sub>: Starts at approximately 0.75 at x=1.0, decreases to approximately 0.55 at x=0.8, decreases to approximately 0.35 at x=0.3.
* ROAR<sub>I</sub><sub>p</sub>: Starts at approximately 0.30 at x=1.0, decreases to approximately 0.20 at x=0.8, decreases to approximately 0.10 at x=0.3.
* ROAR<sub>CD</sub>: Starts at approximately 0.05 at x=1.0, remains relatively stable around 0.05-0.10 between x=0.8 and x=0.3.
### Key Observations
* Generally, as the attack strength decreases (moving from x=1.0 to x=0.3), the HIT@5 score decreases for all strategies.
* BL<sub>I</sub> and BL<sub>II</sub> consistently outperform ROAR<sub>I</sub><sub>p</sub> and ROAR<sub>CD</sub> across all scenarios.
* ROAR<sub>CD</sub> consistently exhibits the lowest HIT@5 scores, indicating its limited effectiveness.
* The performance difference between BL<sub>I</sub> and BL<sub>II</sub> is relatively small.
* The "Default" attack strength (0.7) often shows a noticeable drop in performance compared to the stronger attack strength (0.9 or 1.0).
### Interpretation
The data suggests that the BL (Baseline) strategies are more robust against both backdoor and targeted attacks compared to the ROAR strategies. The ROAR strategies, particularly ROAR<sub>CD</sub>, demonstrate significantly lower performance, indicating their vulnerability to these attacks. The decreasing HIT@5 scores with decreasing attack strength suggest that the defenses become less effective as the attack becomes more subtle. The "Default" attack strength (0.7) appears to be a critical point where performance drops, potentially indicating a threshold where the defenses struggle to detect the attack. The consistent performance of BL<sub>I</sub> and BL<sub>II</sub> suggests that the second baseline strategy does not offer a substantial improvement over the first. These results highlight the need for more effective defense mechanisms against backdoor attacks, especially in scenarios involving commonsense reasoning (Freebase). The charts provide a comparative analysis of different strategies, allowing for informed decision-making regarding the selection of appropriate defenses based on the specific attack scenario and desired level of security.
DECODING INTELLIGENCE...