## Line Chart: Accuracy vs. Steps for Different Algorithms
### Overview
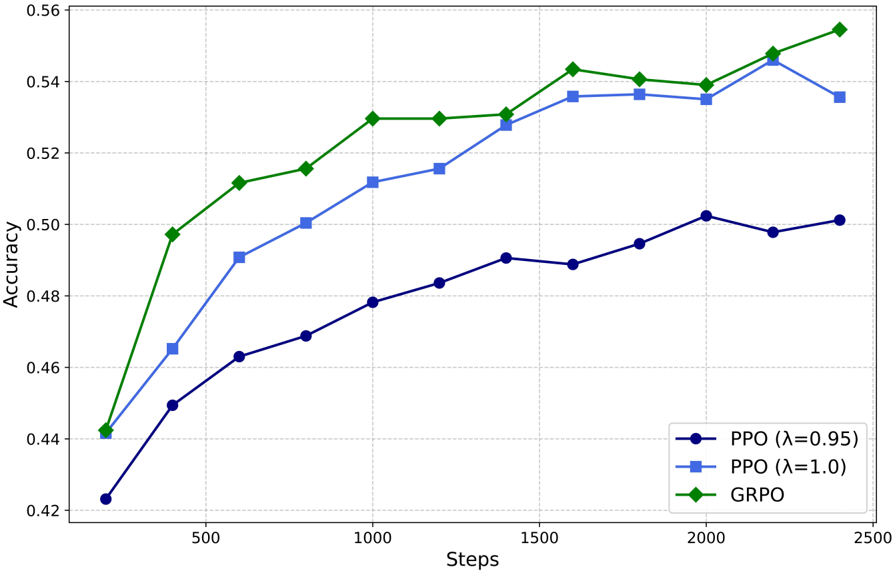
The image is a line chart comparing the accuracy of three different algorithms (PPO with λ=0.95, PPO with λ=1.0, and GRPO) over a range of steps. The chart displays accuracy on the y-axis and steps on the x-axis.
### Components/Axes
* **X-axis:** "Steps", ranging from 0 to 2500, with gridlines at intervals of 500.
* **Y-axis:** "Accuracy", ranging from 0.42 to 0.56, with gridlines at intervals of 0.02.
* **Legend:** Located in the bottom-right corner, it identifies the three algorithms:
* Dark Blue: PPO (λ=0.95)
* Light Blue: PPO (λ=1.0)
* Green: GRPO
### Detailed Analysis
* **PPO (λ=0.95) - Dark Blue Line:**
* Trend: Generally increasing, but plateaus and slightly decreases towards the end.
* Data Points:
* At 250 steps, Accuracy ≈ 0.45
* At 500 steps, Accuracy ≈ 0.47
* At 750 steps, Accuracy ≈ 0.475
* At 1000 steps, Accuracy ≈ 0.48
* At 1250 steps, Accuracy ≈ 0.485
* At 1500 steps, Accuracy ≈ 0.49
* At 1750 steps, Accuracy ≈ 0.495
* At 2000 steps, Accuracy ≈ 0.50
* At 2250 steps, Accuracy ≈ 0.498
* At 2500 steps, Accuracy ≈ 0.502
* **PPO (λ=1.0) - Light Blue Line:**
* Trend: Increasing, but plateaus towards the end.
* Data Points:
* At 250 steps, Accuracy ≈ 0.465
* At 500 steps, Accuracy ≈ 0.49
* At 750 steps, Accuracy ≈ 0.50
* At 1000 steps, Accuracy ≈ 0.515
* At 1250 steps, Accuracy ≈ 0.52
* At 1500 steps, Accuracy ≈ 0.535
* At 1750 steps, Accuracy ≈ 0.535
* At 2000 steps, Accuracy ≈ 0.535
* At 2250 steps, Accuracy ≈ 0.54
* At 2500 steps, Accuracy ≈ 0.535
* **GRPO - Green Line:**
* Trend: Increasing rapidly initially, then plateaus, and increases again slightly at the end.
* Data Points:
* At 250 steps, Accuracy ≈ 0.44
* At 500 steps, Accuracy ≈ 0.495
* At 750 steps, Accuracy ≈ 0.51
* At 1000 steps, Accuracy ≈ 0.53
* At 1250 steps, Accuracy ≈ 0.53
* At 1500 steps, Accuracy ≈ 0.53
* At 1750 steps, Accuracy ≈ 0.545
* At 2000 steps, Accuracy ≈ 0.54
* At 2250 steps, Accuracy ≈ 0.545
* At 2500 steps, Accuracy ≈ 0.55
### Key Observations
* GRPO achieves the highest accuracy overall.
* PPO (λ=1.0) performs better than PPO (λ=0.95).
* All algorithms show diminishing returns in accuracy as the number of steps increases.
### Interpretation
The chart demonstrates the performance of different reinforcement learning algorithms in terms of accuracy over a number of steps. GRPO appears to be the most effective algorithm among the three, achieving the highest accuracy. The PPO algorithm's performance is influenced by the lambda parameter, with λ=1.0 resulting in better accuracy than λ=0.95. The plateauing of the accuracy curves suggests that further training steps may not significantly improve the performance of these algorithms.