## Line Chart: Accuracy vs. Steps for Different PPO and GRPO Algorithms
### Overview
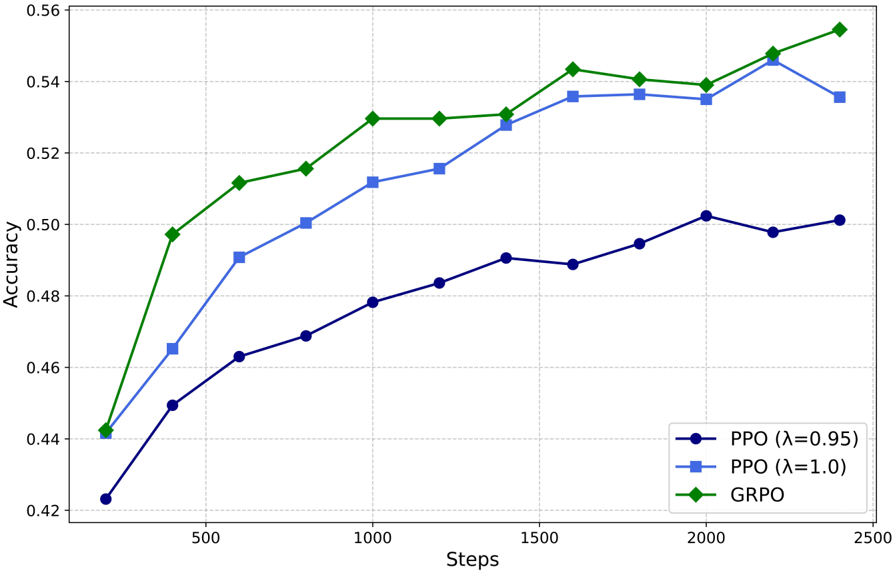
This image presents a line chart comparing the accuracy of three different algorithms – PPO (Proximal Policy Optimization) with λ=0.95, PPO with λ=1.0, and GRPO (Generalized Reward-based Policy Optimization) – over a series of steps. The chart visualizes how the accuracy of each algorithm changes as the number of steps increases.
### Components/Axes
* **X-axis:** "Steps" ranging from 0 to 2500, with markers at 0, 500, 1000, 1500, 2000, and 2500.
* **Y-axis:** "Accuracy" ranging from 0.42 to 0.56, with markers at 0.42, 0.44, 0.46, 0.48, 0.50, 0.52, 0.54, and 0.56.
* **Legend:** Located in the bottom-right corner, identifying the three data series:
* PPO (λ=0.95) – Blue line with circle markers.
* PPO (λ=1.0) – Blue line with square markers.
* GRPO – Green line with diamond markers.
* **Gridlines:** Horizontal and vertical gridlines are present to aid in reading values.
### Detailed Analysis
* **PPO (λ=0.95):** The blue line with circle markers starts at approximately 0.44 at 0 steps. It shows a generally upward trend, with some fluctuations.
* At 500 steps: ~0.49
* At 1000 steps: ~0.52
* At 1500 steps: ~0.53
* At 2000 steps: ~0.54
* At 2500 steps: ~0.54
* **PPO (λ=1.0):** The blue line with square markers starts at approximately 0.46 at 0 steps. It also exhibits an upward trend, but is generally lower than the PPO (λ=0.95) line.
* At 500 steps: ~0.47
* At 1000 steps: ~0.48
* At 1500 steps: ~0.49
* At 2000 steps: ~0.50
* At 2500 steps: ~0.51
* **GRPO:** The green line with diamond markers starts at approximately 0.45 at 0 steps. It demonstrates the steepest upward trend, reaching the highest accuracy values.
* At 500 steps: ~0.51
* At 1000 steps: ~0.54
* At 1500 steps: ~0.55
* At 2000 steps: ~0.54
* At 2500 steps: ~0.55
### Key Observations
* GRPO consistently outperforms both PPO configurations across all steps.
* PPO with λ=0.95 generally achieves higher accuracy than PPO with λ=1.0.
* All three algorithms show diminishing returns in accuracy as the number of steps increases, particularly after 1500 steps.
* The GRPO algorithm shows a more rapid initial increase in accuracy compared to the PPO algorithms.
### Interpretation
The data suggests that GRPO is the most effective algorithm for this task, achieving the highest accuracy levels. The parameter λ in PPO appears to influence performance, with a value of 0.95 yielding better results than 1.0. The diminishing returns observed in all algorithms indicate that further increasing the number of steps may not significantly improve accuracy. This could be due to the algorithms converging towards an optimal solution or reaching the limits of their learning capacity. The initial rapid increase in GRPO's accuracy suggests it may be more efficient at exploring the solution space or adapting to the task's requirements. The differences in performance between the algorithms could be attributed to variations in their underlying mechanisms for policy optimization and reward handling.