## Scatter Plot: Model Performance vs. Reasoning Ability
### Overview
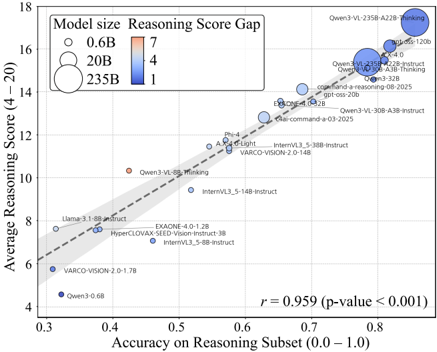
This scatter plot visualizes the relationship between model performance on a reasoning subset (x-axis) and average reasoning scores (y-axis) across various AI models. A dashed regression line with a shaded confidence interval highlights the trend, while data points are color-coded by reasoning score gap and sized by model capacity.
### Components/Axes
- **X-axis**: Accuracy on Reasoning Subset (0.0 – 1.0)
- **Y-axis**: Average Reasoning Score (4–20)
- **Legend**:
- Model size:
- Small (0.6B): Smallest circles
- Medium (20B): Medium circles
- Large (235B): Largest circles
- Reasoning Score Gap: Gradient from red (7) to blue (1)
- **Regression Line**: Dashed line with shaded 95% confidence interval
- **Annotations**: Model names positioned near data points
### Detailed Analysis
- **Regression Line**:
- Slope: Strong positive correlation (r = 0.959)
- Confidence Interval: Shaded gray area around the line
- **Data Points**:
- **Qwen3-VL-235B-A228-Thinking**: (0.85, 17.5) – Largest blue circle (low reasoning gap)
- **Qwen3-VL-235B-A228-Instruct**: (0.82, 16.8) – Large blue circle
- **Qwen3-VL-30B-A38-Instruct**: (0.78, 15.2) – Medium blue circle
- **InternVL3_5-38B-Instruct**: (0.72, 12.0) – Medium blue circle
- **EXAONE-4.0-1.2B**: (0.55, 8.0) – Small blue circle
- **VARCO-VISION-2.0-1.7B**: (0.35, 5.8) – Smallest blue circle
- **Qwen3-0.6B**: (0.3, 4.0) – Smallest blue circle
- **Color Gradient**:
- Red (7): High reasoning score gap (e.g., "Qwen3-VL-8B-Thinking")
- Blue (1): Low reasoning score gap (e.g., "Qwen3-VL-235B-A228-Thinking")
### Key Observations
1. **Strong Correlation**: The near-perfect linear relationship (r = 0.959, p < 0.001) indicates that higher reasoning subset accuracy strongly predicts higher average reasoning scores.
2. **Model Size Trends**:
- Larger models (235B) cluster in the top-right, achieving both high accuracy and reasoning scores.
- Smaller models (0.6B–20B) show lower performance but still follow the trend.
3. **Reasoning Score Gap**:
- Models with smaller gaps (blue) like "Qwen3-VL-235B-A228-Thinking" align closely with the regression line.
- Models with larger gaps (red) like "Qwen3-VL-8B-Thinking" deviate more from the trend.
4. **Outliers**:
- "Llama-3.1-8B-instruct" (0.45, 7.8) falls below the regression line despite moderate accuracy.
- "VARCO-VISION-2.0-1.7B" (0.35, 5.8) is the lowest-performing model.
### Interpretation
The data demonstrates that model scale and reasoning subset accuracy are tightly linked to overall reasoning capability. The reasoning score gap (color gradient) suggests that some models (e.g., "Qwen3-VL-235B-A228-Thinking") achieve high performance with minimal disparity between reasoning and general accuracy, while others (e.g., "Qwen3-VL-8B-Thinking") exhibit significant gaps. The shaded confidence interval confirms the robustness of the trend, though outliers like "Llama-3.1-8B-instruct" highlight potential inefficiencies in smaller models. This analysis underscores the importance of model architecture and training data quality in optimizing reasoning tasks.