## Scatter Plot: Normalized Accuracy Across Model Categories
### Overview
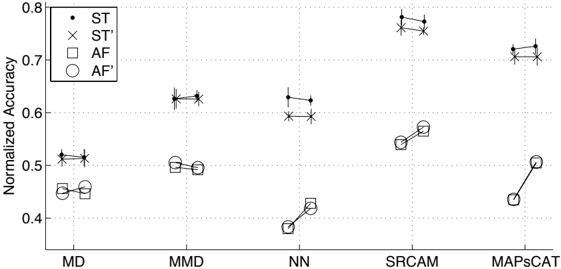
The image is a scatter plot comparing normalized accuracy values across five model categories (MD, MMD, NN, SRCAM, MAPsCAT) for four distinct data series (ST, ST', AF, AF'). The plot uses distinct symbols and colors to differentiate the series, with error bars indicating variability.
### Components/Axes
- **X-Axis (Categories)**: Labeled with model types: MD, MMD, NN, SRCAM, MAPsCAT.
- **Y-Axis (Normalized Accuracy)**: Scaled from 0.4 to 0.8 in increments of 0.1.
- **Legend**: Located in the top-left corner, mapping symbols to series:
- **ST**: Filled black circles (●)
- **ST'**: Black crosses (✖)
- **AF**: Open black squares (■)
- **AF'**: Open black circles (○)
- **Error Bars**: Present for all data points, suggesting measurement uncertainty.
### Detailed Analysis
1. **MD Category**:
- **ST**: ~0.52 (●)
- **ST'**: ~0.51 (✖)
- **AF**: ~0.47 (■)
- **AF'**: ~0.46 (○)
2. **MMD Category**:
- **ST**: ~0.63 (●)
- **ST'**: ~0.62 (✖)
- **AF**: ~0.50 (■)
- **AF'**: ~0.50 (○)
3. **NN Category**:
- **ST**: ~0.61 (●)
- **ST'**: ~0.59 (✖)
- **AF**: ~0.38 (■)
- **AF'**: ~0.42 (○)
4. **SRCAM Category**:
- **ST**: ~0.76 (●)
- **ST'**: ~0.75 (✖)
- **AF**: ~0.55 (■)
- **AF'**: ~0.54 (○)
5. **MAPsCAT Category**:
- **ST**: ~0.72 (●)
- **ST'**: ~0.71 (✖)
- **AF**: ~0.48 (■)
- **AF'**: ~0.50 (○)
### Key Observations
- **ST and ST' Consistently Outperform AF and AF'**: Across all categories, ST and ST' achieve higher normalized accuracy than AF and AF'.
- **SRCAM Dominates**: SRCAM shows the highest accuracy for both ST (~0.76) and ST' (~0.75), suggesting it is the most effective model for these series.
- **MAPsCAT Weakness**: MAPsCAT has the lowest accuracy for AF (~0.48) and AF' (~0.50), indicating potential limitations in handling these series.
- **NN Anomaly**: NN exhibits a significant drop in AF accuracy (~0.38), the lowest observed value for any series.
### Interpretation
The data suggests that ST and ST' (likely supervised or semi-supervised methods) outperform AF and AF' (possibly unsupervised or feature-based approaches) across most model categories. SRCAM’s superior performance for ST/ST' implies it may leverage structural or relational patterns effectively. The NN’s poor AF performance could indicate overfitting or insufficient feature extraction for unsupervised tasks. MAPsCAT’s middling results for AF/AF' suggest moderate adaptability but limited robustness compared to SRCAM. Error bars highlight variability, emphasizing the need for larger datasets or refined models to reduce uncertainty.