## Causal Diagram: Confounders, Treatment, and Outcome
### Overview
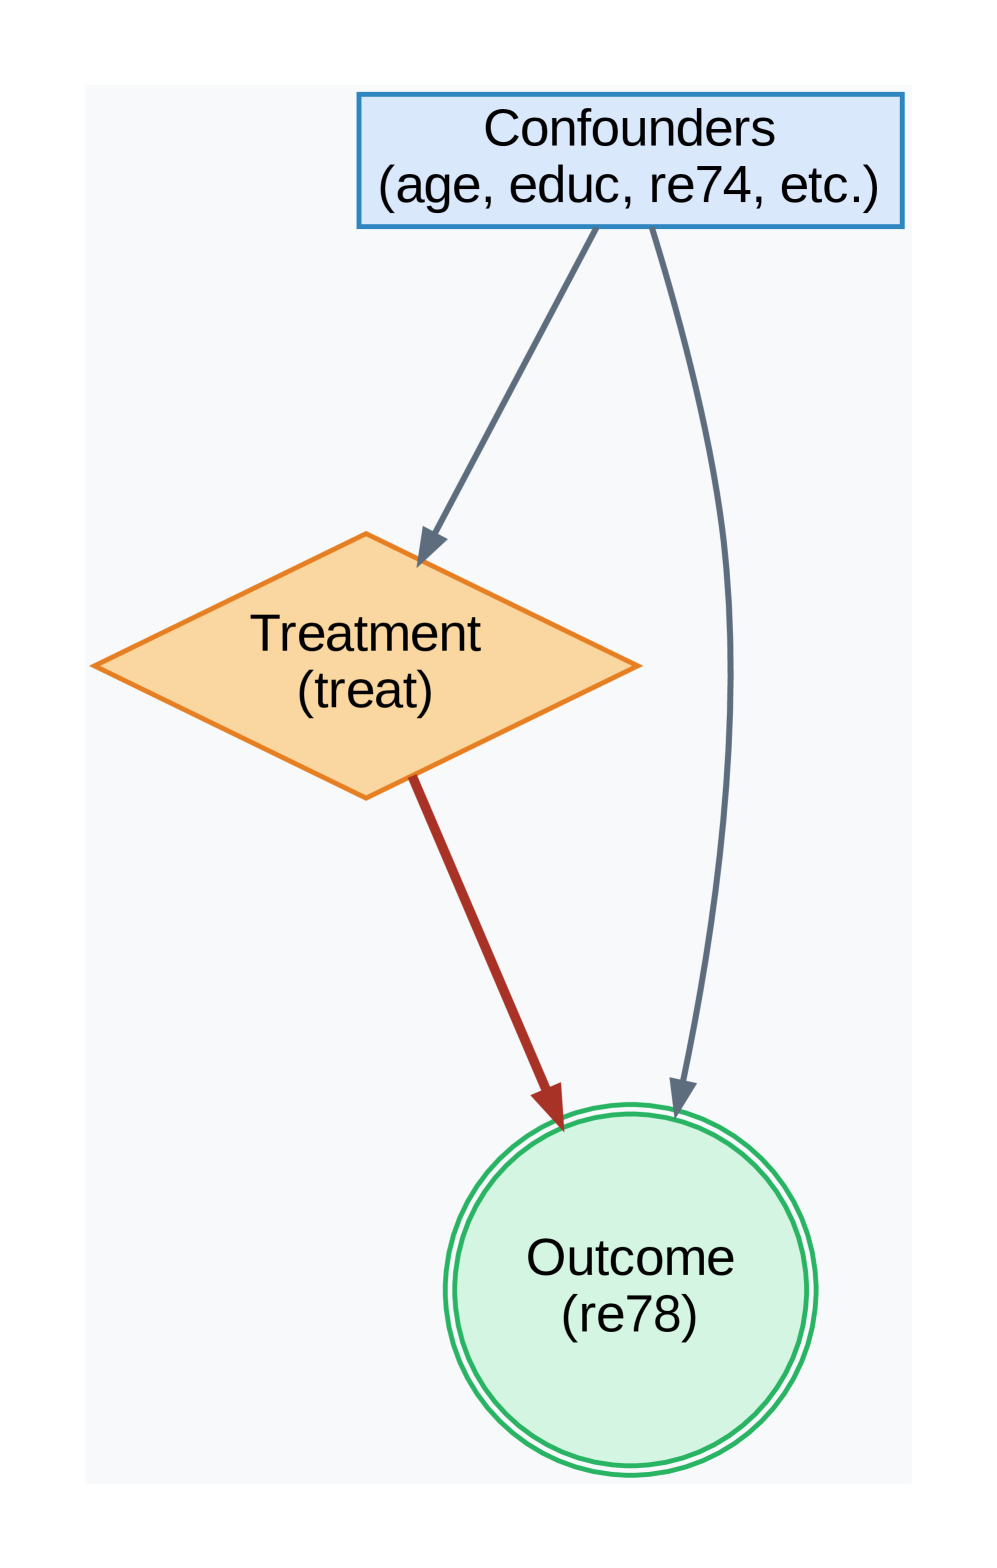
The image presents a causal diagram illustrating the relationships between confounders, treatment, and outcome. The diagram uses nodes to represent variables and arrows to indicate causal relationships.
### Components/Axes
* **Nodes:**
* **Confounders:** Represented by a blue rectangle at the top. The label reads "Confounders" with "(age, educ, re74, etc.)" below it.
* **Treatment:** Represented by an orange diamond in the middle. The label reads "Treatment" with "(treat)" below it.
* **Outcome:** Represented by a green circle at the bottom. The label reads "Outcome" with "(re78)" below it.
* **Arrows:**
* A blue arrow points from "Confounders" to "Treatment".
* A blue arrow curves from "Confounders" to "Outcome".
* A red arrow points from "Treatment" to "Outcome".
### Detailed Analysis
* **Confounders:** The blue rectangle at the top contains the text "Confounders" and lists examples such as "age, educ, re74, etc." This indicates that these factors influence both the treatment and the outcome.
* **Treatment:** The orange diamond in the middle is labeled "Treatment (treat)". This represents the intervention or exposure being studied.
* **Outcome:** The green circle at the bottom is labeled "Outcome (re78)". This represents the result or effect being measured.
* **Causal Paths:**
* The blue arrow from "Confounders" to "Treatment" indicates that confounders influence the treatment received.
* The red arrow from "Treatment" to "Outcome" indicates that the treatment has a direct effect on the outcome.
* The blue arrow from "Confounders" to "Outcome" indicates that confounders also directly influence the outcome, independent of the treatment.
### Key Observations
* The diagram highlights the potential for confounding, where the observed relationship between treatment and outcome may be influenced by other factors.
* The curved arrow from "Confounders" to "Outcome" suggests a non-linear or complex relationship.
### Interpretation
The causal diagram illustrates a common scenario in observational studies where confounders can distort the observed effect of a treatment on an outcome. The diagram suggests that to accurately estimate the treatment effect, it is necessary to account for the influence of confounders on both the treatment and the outcome. The diagram emphasizes the importance of considering potential confounders when analyzing the relationship between treatment and outcome.