## Line Chart: Competition Level Accuracy
### Overview
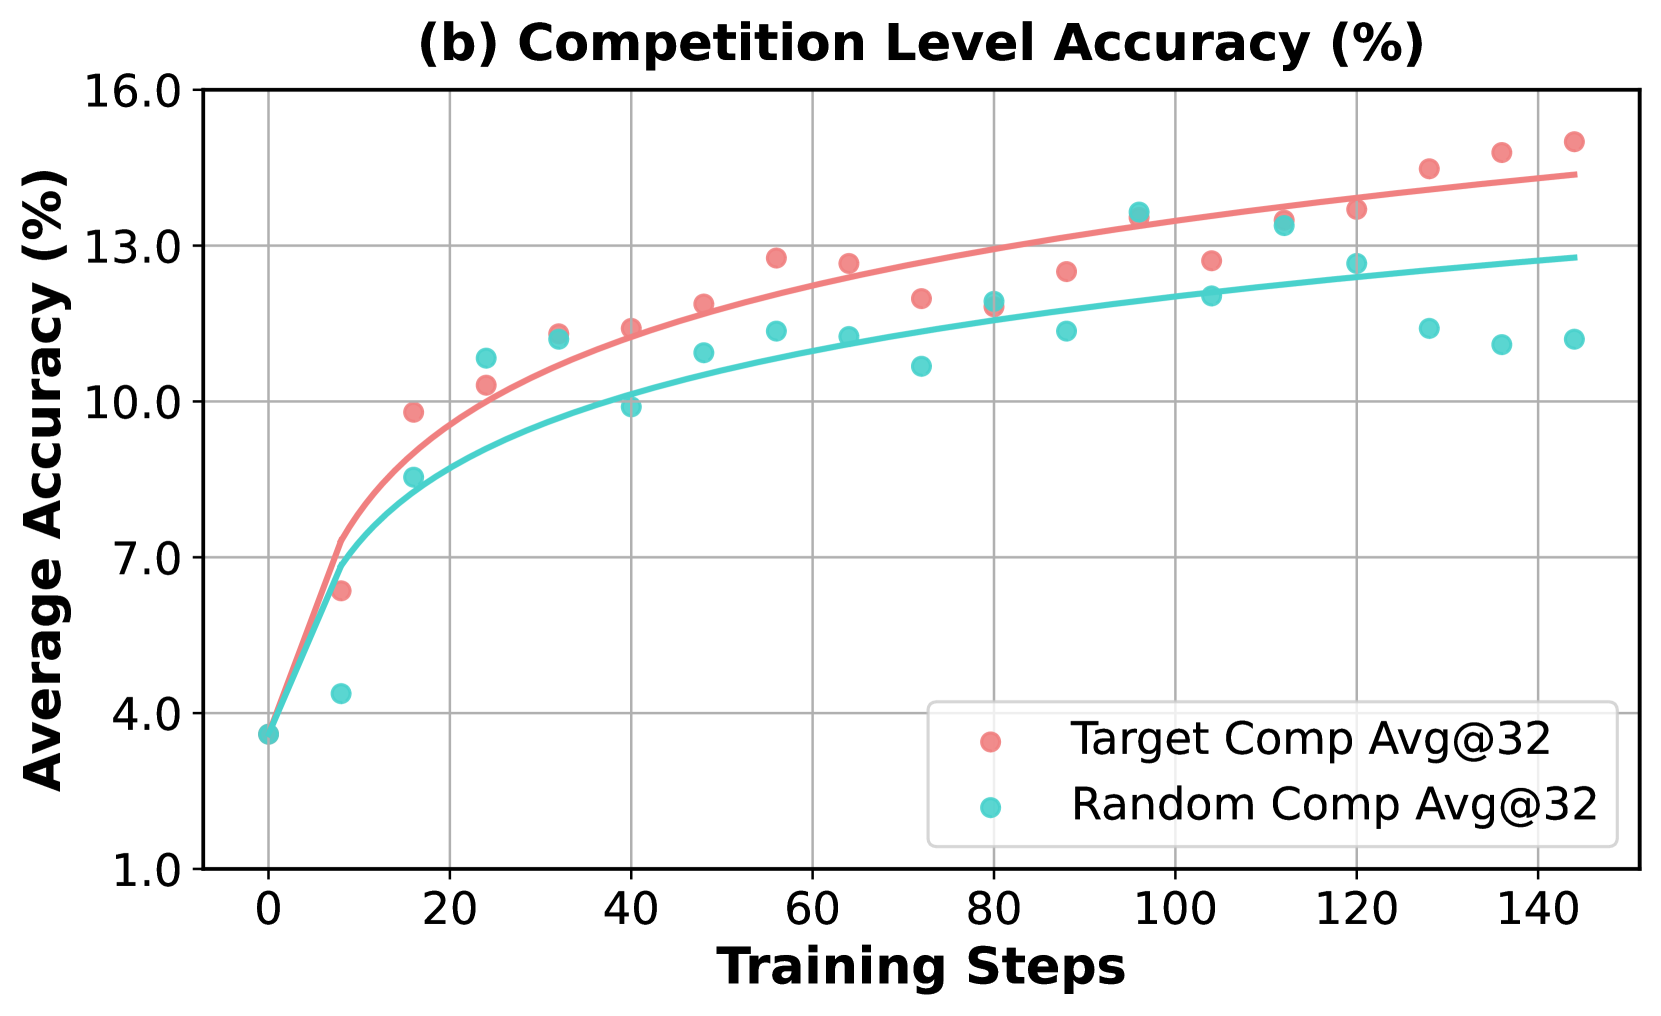
The image is a line chart comparing the average accuracy (%) of two different competition strategies, "Target Comp Avg@32" and "Random Comp Avg@32", over a range of training steps. The chart displays how the accuracy of each strategy evolves as the number of training steps increases.
### Components/Axes
* **Title:** (b) Competition Level Accuracy (%)
* **X-axis:** Training Steps, with markers at 0, 20, 40, 60, 80, 100, 120, and 140.
* **Y-axis:** Average Accuracy (%), with markers at 1.0, 4.0, 7.0, 10.0, 13.0, and 16.0.
* **Legend:** Located in the bottom-right corner.
* **Target Comp Avg@32:** Represented by a light red line and data points.
* **Random Comp Avg@32:** Represented by a light blue line and data points.
### Detailed Analysis
* **Target Comp Avg@32 (Light Red):**
* **Trend:** The accuracy increases rapidly in the initial training steps and then plateaus as the number of steps increases.
* **Data Points:**
* At 0 Training Steps: Approximately 4.0% accuracy.
* At 20 Training Steps: Approximately 10.0% accuracy.
* At 40 Training Steps: Approximately 12.0% accuracy.
* At 60 Training Steps: Approximately 12.5% accuracy.
* At 80 Training Steps: Approximately 12.8% accuracy.
* At 100 Training Steps: Approximately 13.2% accuracy.
* At 120 Training Steps: Approximately 13.5% accuracy.
* At 140 Training Steps: Approximately 14.0% accuracy.
* **Random Comp Avg@32 (Light Blue):**
* **Trend:** The accuracy increases rapidly in the initial training steps and then plateaus as the number of steps increases, but at a lower level than "Target Comp Avg@32".
* **Data Points:**
* At 0 Training Steps: Approximately 4.0% accuracy.
* At 20 Training Steps: Approximately 6.0% accuracy.
* At 40 Training Steps: Approximately 10.5% accuracy.
* At 60 Training Steps: Approximately 11.5% accuracy.
* At 80 Training Steps: Approximately 11.8% accuracy.
* At 100 Training Steps: Approximately 12.5% accuracy.
* At 120 Training Steps: Approximately 12.8% accuracy.
* At 140 Training Steps: Approximately 12.5% accuracy.
### Key Observations
* Both strategies show a rapid increase in accuracy during the initial training phase.
* The "Target Comp Avg@32" strategy consistently outperforms the "Random Comp Avg@32" strategy in terms of average accuracy.
* Both strategies exhibit a plateau effect, where the increase in accuracy diminishes as the number of training steps increases.
### Interpretation
The data suggests that the "Target Comp Avg@32" strategy is more effective than the "Random Comp Avg@32" strategy for improving competition level accuracy. The plateau effect indicates that there may be a limit to the achievable accuracy with these strategies, or that further training steps may yield diminishing returns. The relationship between the two lines shows that the "Target Comp Avg@32" consistently maintains a higher accuracy level throughout the training process.